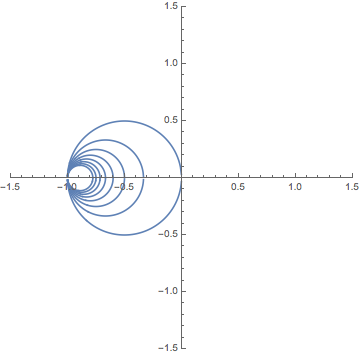
I would like to visualize the complex function $f(z)=\dfrac{i-z}{i+z}$ by plotting the images of different horizontal lines in the upper half plane under this map.
With the following code
f[z_] := (I - z)/(I + z);
ParametricPlot[{Re[f[x + I*2]], Im[f[x + I*2]]}, {x, -100, 100},
 PlotRange -> {{-1.5, 1.5}, {-1.5, 1.5}}]
I am able to plot the image of one horizontal line. How can I do it for multiple ones in one graph?
The following code makes the plot rather ugly:
ParametricPlot[{Re[f[x + I*y]], Im[f[x + I*y]]}, {x, -100, 100}, {y,0,4}
     PlotRange -> {{-1.5, 1.5}, {-1.5, 1.5}}]
I'm wondering how I can plot it for "discrete" range: e.g. {y,{0,1,2,3,3.5}}.
I have also read a related question Image of first quadrant under $f(z)=(z+i)/(z-i)$, the answers of which seem not to be very helpful here.

