18
$\begingroup$

I have the function:

$F(\omega) = \frac{5\; - \;i\;\omega}{5^2\; +\; \omega^2}$

When $\omega$ has the values :

$\{ -7, -2,\; 0,\; 2,\; 7\}$

How would I plot the Argand diagram in Mathematica? Or should I just treat it as a normal plot?

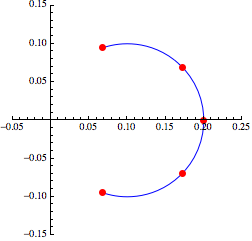
The graph should look like a circle with radius $\frac{1}{10}$ passing through the points specified.

$\endgroup$
5
  • $\begingroup$ Please take a look at Re, Im and ListPlot. $\endgroup$
    – Szabolcs
    Commented Dec 3, 2012 at 19:23
  • $\begingroup$ The answer to your last question is, that it depends on what features of the function/plot you want to emphasize. $\endgroup$
    – JohnD
    Commented Dec 3, 2012 at 19:24
  • $\begingroup$ @Artes nice answers to second post ;-) $\endgroup$
    – chris
    Commented Dec 3, 2012 at 20:36
  • $\begingroup$ @Dean It would be resonable to specify in your question definitely what kind of diagram you expect. $\endgroup$
    – Artes
    Commented Dec 5, 2012 at 20:12
  • $\begingroup$ @Artes Yes just done that. $\endgroup$
    – Dean
    Commented Dec 6, 2012 at 13:58

6 Answers 6

34
$\begingroup$

Defining the function F and a subset of its domain : pts :

F[z_] := (5 - I z)/(5^2 + z^2)
pts = {-7, -2, 0, 2, 7};

the most straightforward way fulfilling the task is based on ParametricPlot and Epilog. We can also make a diagram with the basic graphics primitives like e.g. : Line, Circle, Point. Here are the both ways enclosed in GraphicsRow :

GraphicsRow[{
    Graphics[{Line[{{0, -0.1}, {0, 0.1}}], Line[{{0, 0}, {0.21, 0}}],
              Blue, Thick, Circle[{0.1, 0}, 0.1], 
              Red, PointSize[.03], Point[{Re @ #, Im @ #} & /@ F[pts]]}], 

    ParametricPlot[{Re @ #, Im @ #}& @ F[z], {z, -200, 200}, PlotRange -> All, 
                   PlotStyle -> Thick, Epilog -> { Red, PointSize[0.03],
                   Point[{Re @ F @ #, Im @ F @ #} & /@ pts]}] }]
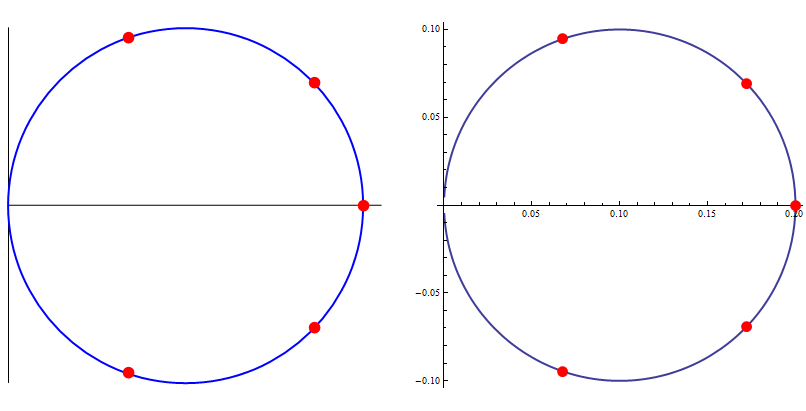
enter image description here

Studying properties of holomorphic complex mappings is really rewarding, therefore one should take a closer look at it. This function has a simple pole in 5 I :

Residue[ F[z], {z, 5 I}]
-I

and it is conformal in its domain :

Reduce[ D[ F[z], z] == 0, z]
False

i.e. it preserves angles locally. One can easily recognize the type of F evaluating Simplify[ F[z]], namely it is a composition of a translation, rescaling and inversion. We should look at images (via F) of simple geometric objects. To visualize the structure of the mapping F we choose an appropriate grid in the complex domain of F and look at its image. We take a continuous parameter $t$ varying in a range $(-25, 25)$ and contours $\;t+ i\;y $ for $y$ in a discrete set of values $\{-3, -2,-1, 0, 1, 2, 3 \}$ and another orthogonal contours $\;x+ i\;t$ for $x$ in a discrete set $\{-7,-5,-3, -2, 0, 2, 3, 5, 5\;\}$, i.e.we have a grid of straight lines in the complex plane. Next we'd like to plot the image of this grid through the mapping $F$. Images of every line in the grid will be circles with centers on the abscissa and ordinate respectively intersecting orthogonally. The red points denote values of $F(x)$ on the complex plane for $x$ in $\{-7, -2, 0, 2, 7 \}$. On the lhs we have the original grid in the domain of F and on the rhs we have the plot of its image :

Animate[
  GraphicsRow[
    ParametricPlot[ ##, Evaluated -> True, PlotStyle -> Thick] & @@@ {
      { Join @@ {Table[{t, k}, {k, -3, 3}],
                 Table[{k, t}, {k, {-7, -5, -3, -2, 0, 2, 3, 5, 7}}]},
      {t, -25, a}, PlotRange -> {{-30, 30}, {-30, 30}}, 
      Epilog -> {Red, PointSize[0.015], Point[{#, 0} & /@ pts]} },

      { Join @@ {Table[{Re @ F[t + I k], Im @ F[t + I k]}, {k, -3, 3}], 
                 Table[{Re @ F[k + I t], Im @ F[k + I t]}, 
                       {k, {-7, -5, -3, -2, 0, 2, 3, 5, 7}}]},
      {t, -25, a}, PlotRange -> {{-.4, .6}, {-.51, .51}},
      Epilog -> { Red, PointSize[0.015], 
                  Point[{Re @ F[#], Im @ F[#]} & /@ pts]}}}, 
    ImageSize -> 800 ],        {a, -25 + 0.1, 25}]
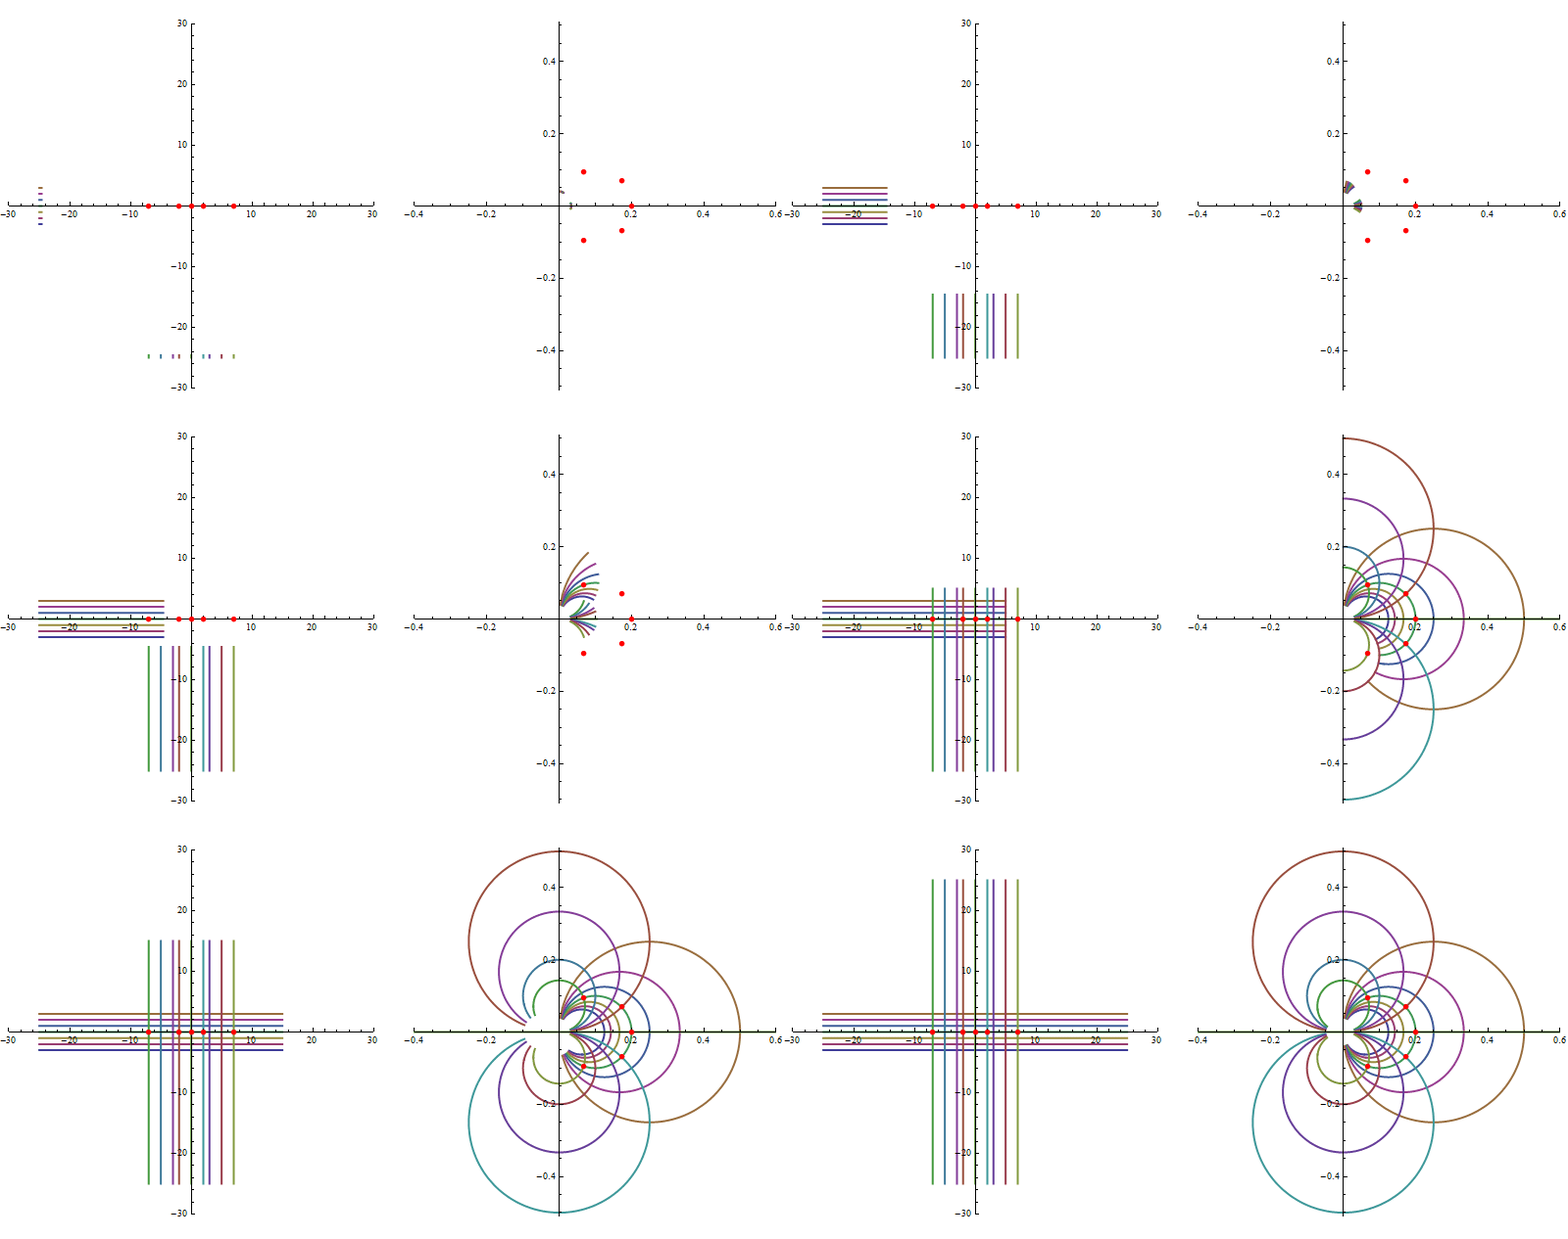
enter image description here

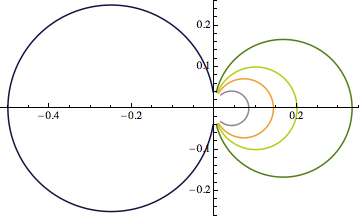
and slightly modyfing the ranges of the last ParametricPlot : {t, -300, 300}, and PlotRange -> {{-.2, .3}, {-.25, .25}} :

ParametricPlot[ 
    Join @@ { Table[{Re @ F[t + I k], Im @ F[t + I k]}, {k, -3, 3}], 
              Table[{Re @ F[k + I t], Im @ F[k + I t]},
                    {k, {-7, -5, -3, -2, 0, 2, 3, 5, 7}}]}, {t, -300, 300},
    PlotRange -> {{-.2, .3}, {-.25, .25}}, Epilog -> {Red, PointSize[0.015], 
    Point[{Re @ #, Im @ #} & /@ F @ pts]}, 
    Evaluated -> True, PlotStyle -> Thick]
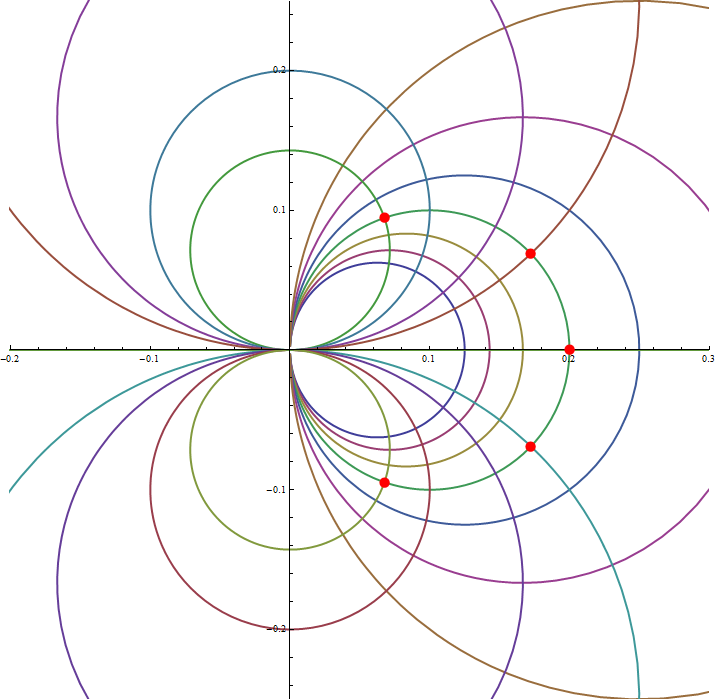
enter image description here

$\endgroup$
3
  • 1
    $\begingroup$ You're welcome. Also corrected a tiny error in your code. $\endgroup$ Commented Dec 4, 2012 at 0:38
  • 1
    $\begingroup$ Another fine example of the power of a great visualization. $\endgroup$
    – JohnD
    Commented Dec 13, 2012 at 20:52
  • 1
    $\begingroup$ As of 10.1 the plotting bits can be simplified with ReIm[z] as opposed to {Re@z, Im@z}. $\endgroup$ Commented Mar 9, 2016 at 10:24
6
$\begingroup$

Using

f[w_] := (5 - I w)/(5^2 + w^2)

you can find the values of your list:

vals = f[{-7, -2, 0, 2, 7}]
(* Out[] := {5/74+(7 I)/74,5/29+(2 I)/29,1/5,5/29-(2 I)/29,5/74-(7 I)/74} *)

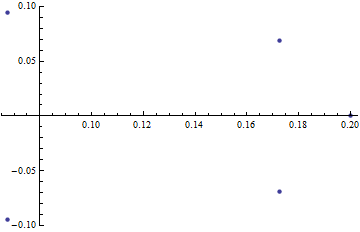
Then, you simply need to extract the real and imaginary parts, and plot them as {x,y} coordinates:

coords = Transpose@Through@{Re, Im}@vals;
ListPlot[coords, PlotStyle -> Directive[PointSize[Medium]], PlotRange -> All]

Mathematica graphics

$\endgroup$
6
$\begingroup$

I am not quite sure what an Argand diagram is, but if I had to guess...

F[ω_] = (5 - I ω)/(5^2 + ω^2)


Table[
  ParametricPlot[
   F[ω+ I η] /.η -> eta // {Re[#], Im[#]} & // 
    Evaluate, {ω, -25, 25}, 
   PlotStyle -> ColorData[10][(eta + 7)/1.4]], {eta, {-7, -2, 0, 2, 
    7}}] // Show[#, PlotRange -> All, AxesOrigin -> {0, 0}] &

Mathematica graphics

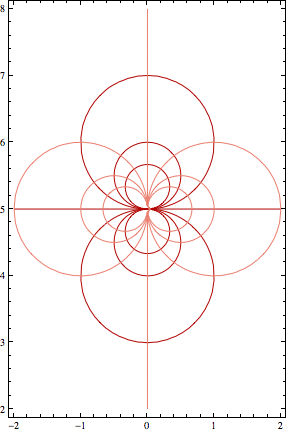
Or maybe it's something like this?

Table[ContourPlot[{Re[F[x + y I]], Im[F[x + y I]]}[[i]], {x, -2, 
    2}, {y, 2, 8},
   ContourShading -> False, ContourStyle -> ColorData[10][i]],
  {i, 2}] // Show[#, AspectRatio -> 6/4] &

Mathematica graphics

$\endgroup$
4
  • $\begingroup$ You've just hit 4k ! $\endgroup$
    – Artes
    Commented Dec 7, 2012 at 19:31
  • $\begingroup$ @Artes probably a good time to stop ;-) $\endgroup$
    – chris
    Commented Dec 7, 2012 at 19:35
  • 1
    $\begingroup$ "Argand diagram" is just another way to describe the standard geometric representation of the complex numbers as a plane. $\endgroup$
    – murray
    Commented Dec 10, 2012 at 22:18
  • $\begingroup$ @Artes thanks for pointing it out. This answer is pretty much obsolete though now... $\endgroup$
    – chris
    Commented Dec 13, 2012 at 19:56
4
$\begingroup$

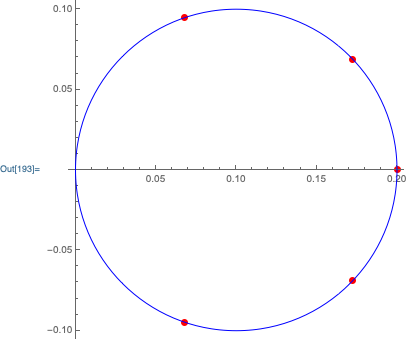
You can use the new in M12 function ComplexListPlot:

ComplexListPlot[
    Table[(5 - I ω)/(5^2 + ω^2), {ω, {-7, -2, 0, 2, 7}}],
    AxesOrigin -> {0, 0},
    PlotStyle -> Directive[Red, PointSize[Large]],
    Epilog -> {Blue, Circle[{1/10, 0}, 1/10]}
]

enter image description here

$\endgroup$
3
$\begingroup$

Mathematica "prefers" complex numbers to real numbers in various ways -- except unfortunately when it comes to plotting, where it expects you to break things apart into real and complex parts. But if you apply David Park's Presentations add-on, then you may work directly with complex numbers in plotting. And, as in this example, let Mathematica do the work of showing that the image points lie on a circle:

<<Presentations`
F[z_] := (5 - I z)/(5^2 + z^2)
pts = {-7, -2, 0, 2, 7};
xAxis = ComplexCurve[ -7 ( 1 - t ) + 7 t, {t, 0, 1}];

Draw2D[{
        { Blue, xAxis, PointSize[Large], Red, ComplexPoint /@ pts} // ComplexMap[F]
       },
       Axes -> True,
       PlotRange -> ComplexPlotRange[-0.05 - 0.15 I, 0.25 + 0.15 I ],
       ImageSize -> Scaled[0.45] ]

Mathematica graphics

$\endgroup$
2
$\begingroup$

If you have a list $b$ of complex numbers, the quickest way I have found to plot them is:

ListPlot[Table[{Re[b[[k]]], Im[b[[k]]]}, {k, 1, 4}]]

Here $b$ has 4 complex numbers in it.

$\endgroup$

Your Answer

By clicking “Post Your Answer”, you agree to our terms of service and acknowledge you have read our privacy policy.

Not the answer you're looking for? Browse other questions tagged or ask your own question.