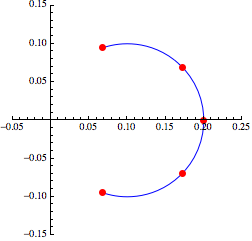
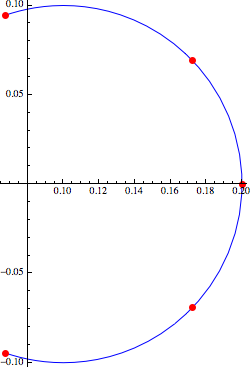
MathematicaMathematica "prefers" complex numbers to real numbers in various ways --except except unfortunately when it comes to plotting, where it expects you to break things apart into real and complex parts. But if you apply David Park's PresentationsPresentations add-on (http://home.comcast.net/~djmpark/DrawGraphicsPage.html), then you may work directly with complex numbers in plotting. And, as in this example, let Mathematica do the work of showing that the image points lie on a circle:
<<Presentations`
F[z_] := (5 - I z)/(5^2 + z^2)
pts = {-7, -2, 0, 2, 7};
xAxis = ComplexCurve[ -7 ( 1 - t ) + 7t7 t, {t, 0, 1}];

Draw2D[{
        { Blue, xAxis, PointSize[Large], Red, ComplexPoint /@pts@ pts} // ComplexMap[F]
       },
       Axes -> True,
       PlotRange ->ComplexPlotRange[> ComplexPlotRange[-0.05 - 0.15I15 I, 0.25+025 + 0.15I]15 I ],
       ImageSize ->Scaled[0> Scaled[0.45]]45] ]


