1
$\begingroup$

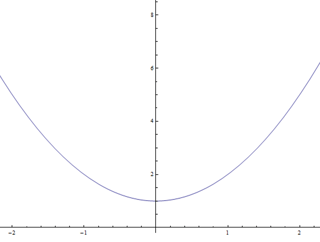
I would like to plot graphs of functions like this: $ f(x)=x^2 +1 $

2D Parabola

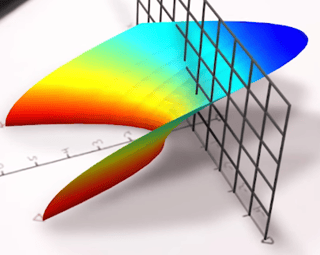
But in a tridimensional complex space. It should look like this:

3D parabola

I am not sure if this has been asked before (Plotting Complex Quantity Functions). But this is a real function of just one variable. I don't want to see its projection in the complex plane. I want to see the entire complex space of the function

$\endgroup$
2

1 Answer 1

4
$\begingroup$

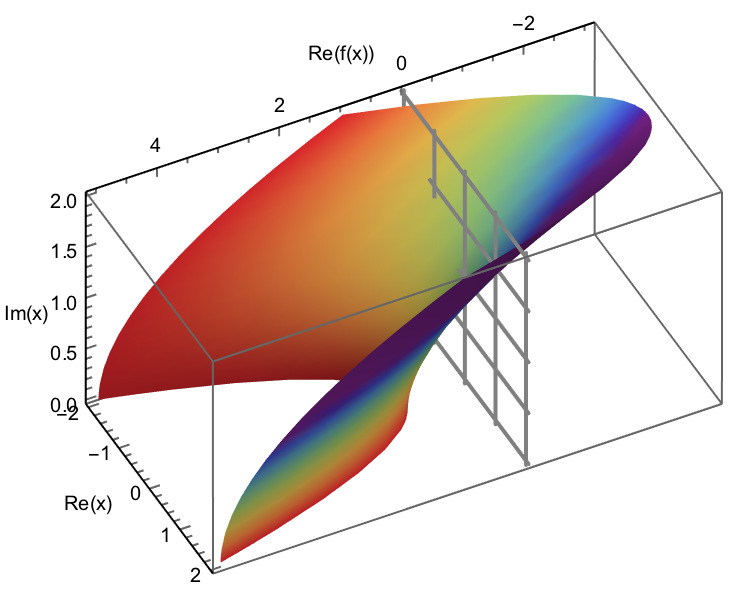
Is this what you want? I hope the code is self-explanatory...

Plot3D

f[x_, y_] := (x + y I)^2 + 1
xmin = -2;
xmax = 2;
ymin = 0;
ymax = 2;
Show[
  Plot3D[
    Re @ f[x, y],
    {x, xmin, xmax},
    {y, ymin, ymax},
    AxesLabel -> {"Re(x)", "Im(x)", "Re(f(x))"},
    AxesStyle -> Black,
    LabelStyle -> Black,
    BoxRatios -> {1, 1, 2},
    ColorFunction -> Function[{x, y, z}, ColorData[{"Rainbow", "Reversed"}][Im @ f[x, y]]],
    ViewVertical -> {0, 1, 0},
    ViewPoint -> 1000 {1, 1, 1/2},
    Boxed -> True,
    Mesh -> None,
    BoundaryStyle -> None
  ],
  Graphics3D[
    {
      Gray,
      Thick,
      Table[
        InfiniteLine[{{xmin, y, 0}, {xmax, y, 0}}],
        {y, ymin, ymax, 1/2}
      ],
      Table[
        InfiniteLine[{{x, ymin, 0}, {x, ymax, 0}}],
        {x, xmin, xmax, 1}
      ]
    }
  ]
]
$\endgroup$

Your Answer

By clicking “Post Your Answer”, you agree to our terms of service and acknowledge you have read our privacy policy.

Not the answer you're looking for? Browse other questions tagged or ask your own question.