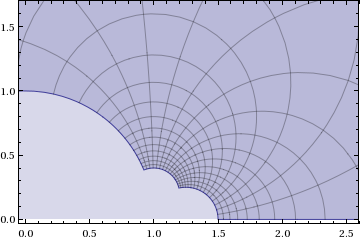
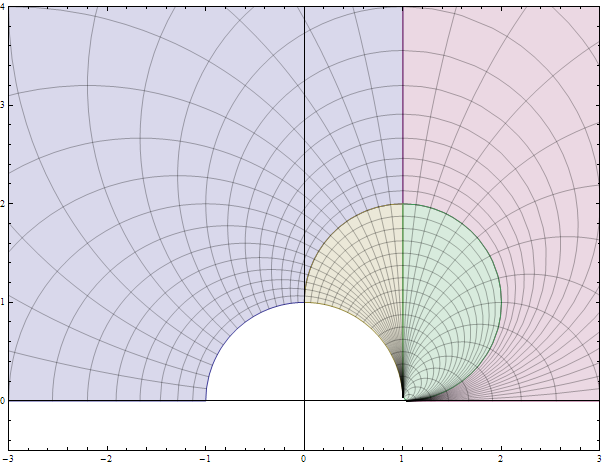
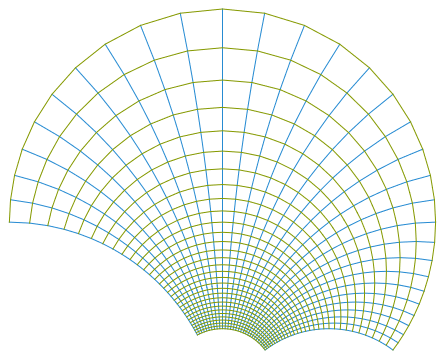
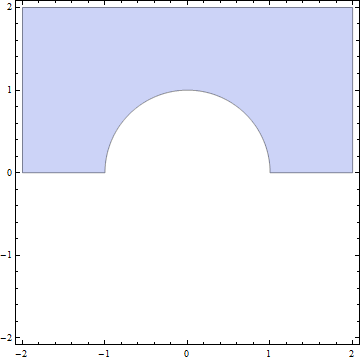
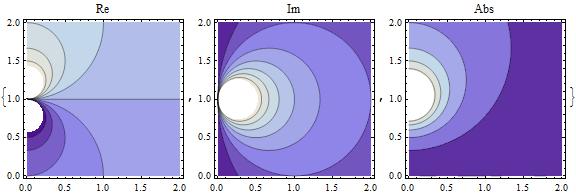
Since a complex function is involved, it seems natural to use plotting functions that treat complex objects directly, without having to overtly separate them into real and imaginary parts. David Park's Presentations add-on (http://home.comcast.net/~djmpark/DrawGraphicsPage.html) allows this:
<< Presentations`

With[{f = Function[z, (z + I)/(z - I)],
      zmin = -(1 + I), zmax = (1 + I)},
      grid = DrawCartesianMap[z, {z, 0, 2 zmax}, Mesh -> {12, 12},
             PlotPoints -> 60, MaxRecursion -> 5,
             BoundaryStyle -> Directive[Thick, Black, Dashed],
             MeshStyle -> {{Thickness[0.0065], HTML@DarkGreen},
                           {Thickness[0.0065], Darker@Brown}}];
      domainObjects = {Opacity[0.5, HTML@Wheat], grid};
      imageObjects = ComplexMap[f][domainObjects];
      Row[{
           Draw2D[{domainObjects},
                  PlotRange -> ComplexPlotRange[0.5 zmin, 2 zmax], Frame -> True,
                  PlotLabel -> z, ImageSize -> Scaled[0.3], BaseStyle -> 12],
           Draw2D[{Arrowheads[.3], NeedhamMappingSymbol[0, 1]},
                   PlotRange -> All, ImageSize -> Scaled[0.05]],
           Draw2D[{imageObjects},
                   PlotRange -> ComplexPlotRange[-5 - I, 5 zmax], Frame -> True,
                   PlotLabel -> f[z], ImageSize -> Scaled[0.3], BaseStyle -> 12]
          },
          Spacer[5], ImageSize -> 720]
    ]


