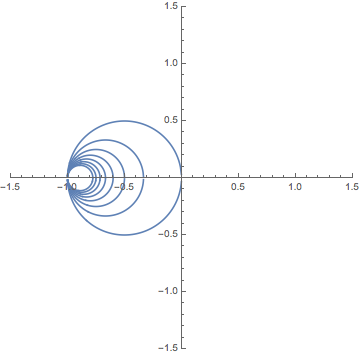
You can use your code to plot multiple versions using Show. Here it is over the range 1 to 8.
f[z_] := (I - z)/(I + z);
Show[ParametricPlot[{Re[f[x + I*#]], Im[f[x + I*#]]}, {x, -100, 100},
    PlotRange -> {{-1.5, 1.5}, {-1.5, 1.5}}] & /@ Range[1, 8]]
If you are finding the Map/Slot confusing, you can accomplish the same thing using Table:
Show[Table[ParametricPlot[{Re[f[x + I*i]], Im[f[x + I*i]]}, {x, -100, 100},
   PlotRange -> {{-1.5, 1.5}, {-1.5, 1.5}}], {i, 1, 8}]]

