24
$\begingroup$

Let us first define two positive definite matrices:

M1 = {{2, -6}, {4, 8}};
M2 = {{2, 3}, {4, 8}};

then set two points p1={-1,-1} and p2={1,1}. Finally we define an anisotropic distance function, namely:

d[q1_, q2_, M_] := Sqrt[(q1 - q2).M.(q1 - q2)]

When trying to plot the anisotropic Voronoi cells as follows:

Show[
 Graphics[Point[{p1, p2}]],
 RegionPlot[
  {
   d[{x, y}, p1, M1] < d[{x, y}, p2, M2],
   d[{x, y}, p1, M1] > d[{x, y}, p2, M2]
   },
  {x, -4, 4}, {y, -4, 4}
  ]
 ]

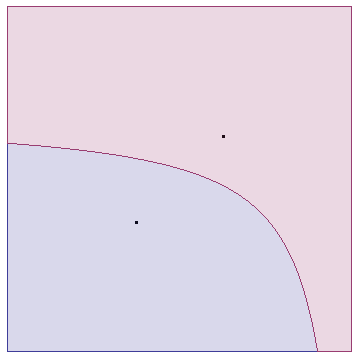
I obtain the following image:
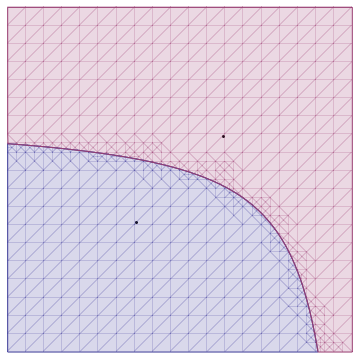
Resulting image with unwanted mesh

My question is: How can I get rid of the underlying mesh, which is visible in this example?

Two remarks:

  1. Removing the points' plotting also removes the mesh.
  2. Adding something like Mesh->None to the RegionPlot doesn't help.

Edit:

It seems this problem is specific to Mac OS X. Here is the Options[RegionPlot] output:

{AlignmentPoint -> Center, AspectRatio -> 1, Axes -> False, 
 AxesLabel -> None, AxesOrigin -> Automatic, AxesStyle -> {}, 
 Background -> None, BaselinePosition -> Automatic, BaseStyle -> {}, 
 BoundaryStyle -> Automatic, ColorFunction -> Automatic, 
 ColorFunctionScaling -> True, ColorOutput -> Automatic, 
 ContentSelectable -> Automatic, CoordinatesToolOptions -> Automatic, 
 DisplayFunction :> $DisplayFunction, Epilog -> {}, 
 Evaluated -> Automatic, EvaluationMonitor -> None, 
 FormatType :> TraditionalForm, Frame -> True, FrameLabel -> None, 
 FrameStyle -> {}, FrameTicks -> Automatic, FrameTicksStyle -> {}, 
 GridLines -> None, GridLinesStyle -> {}, ImageMargins -> 0.`, 
 ImagePadding -> All, ImageSize -> Automatic, 
 ImageSizeRaw -> Automatic, LabelStyle -> {}, 
 MaxRecursion -> Automatic, Mesh -> None, 
 MeshFunctions -> {#1 &, #2 &}, MeshShading -> None, 
 MeshStyle -> Automatic, Method -> Automatic, 
 PerformanceGoal :> $PerformanceGoal, PlotLabel -> None, 
 PlotPoints -> Automatic, PlotRange -> Full, 
 PlotRangeClipping -> True, PlotRangePadding -> Automatic, 
 PlotRegion -> Automatic, PlotStyle -> Automatic, 
 PreserveImageOptions -> Automatic, Prolog -> {}, RotateLabel -> True,
  TextureCoordinateFunction -> Automatic, 
 TextureCoordinateScaling -> Automatic, Ticks -> Automatic, 
 TicksStyle -> {}, WorkingPrecision -> MachinePrecision}
$\endgroup$
8
  • $\begingroup$ This mesh should not appear by default. Does it appear in other types of graphics, like DensityPlot for example? What OS and Mathematica version? $\endgroup$ Commented Feb 6, 2012 at 12:11
  • 1
    $\begingroup$ No mesh when I plot it on M 7.0.1.0, XP SP3 $\endgroup$ Commented Feb 6, 2012 at 12:13
  • $\begingroup$ Just in case: could you please include the result of Options[RegionPlot] in your question? $\endgroup$ Commented Feb 6, 2012 at 12:13
  • 1
    $\begingroup$ I get a mesh in Mathematica v8.0.4 on OS X Lion $\endgroup$
    – Heike
    Commented Feb 6, 2012 at 12:38
  • 1
    $\begingroup$ I get a mesh on 8.0.4 on OS X Snow Leopard. $\endgroup$ Commented Feb 6, 2012 at 21:33

3 Answers 3

28
$\begingroup$

You are combining the images in the form

Show[Graphics[simplePrimitives], complicatedRegionPlot]

The options in the resulting figure are inherited from the first term, namely Graphics[simplePrimitives]. This does not include the "TransparentPolygonMesh" -> True generated by RegionPlot. You see the mesh as a result. If you combine things as follows:

Show[complicatedRegionPlot, Graphics[simplePrimitives]]

Then the resulting image will have the standard RegionPlot options and you'll no longer see the mesh.

I think the preferred way to do this, however, is to use Epilog, as in J.M.'s response.

$\endgroup$
6
  • 2
    $\begingroup$ +1 for explaining why the mesh shows up in addition to fixing the problem $\endgroup$ Commented Feb 6, 2012 at 13:44
  • $\begingroup$ What OS are you using? I see no mesh at all. I wonder if the mesh is a Mac-only thing. $\endgroup$
    – Szabolcs
    Commented Feb 6, 2012 at 14:04
  • $\begingroup$ The simplest solution in some sense although the others work as well. $\endgroup$
    – Dror
    Commented Feb 6, 2012 at 14:49
  • $\begingroup$ @Szabolcs I used V8.0.4 on Mac OS X. I can confirm that V8.0.0 on Windows running in Virtual Machine displays no Mesh. That's odd. The inconsistency seems to be a bug to me. $\endgroup$ Commented Feb 6, 2012 at 15:21
  • $\begingroup$ Just a guess: Maybe graphics rendering is done differently on different platforms (or different modes are enabled by default), and some idiosyncrasy of the Mac rendering forced the developers to use this workaround. I noticed that @Heike's screenshot is not antialiased. Antialiasing is missing on Windows only when hardware accelerated rendering is used (this mode is automatically turned on e.g. if a Polygon with different VertexColors is included, but it's usually off) $\endgroup$
    – Szabolcs
    Commented Feb 6, 2012 at 15:42
22
$\begingroup$

You could use the (undocumented) option Method -> {"TransparentPolygonMesh" -> True} for this, e.g.

Show[Graphics[Point[{p1, p2}]], 
 RegionPlot[{d[{x, y}, p1, M1] < d[{x, y}, p2, M2], 
   d[{x, y}, p1, M1] > d[{x, y}, p2, M2]}, {x, -4, 4}, {y, -4, 4}],
 Method -> {"TransparentPolygonMesh" -> True}]

which produce

Mathematica graphics

$\endgroup$
1
  • $\begingroup$ Method -> {"TransparentPolygonMesh" -> True} is not documented, for Graphics, in Mathematica 10.3.1 (and possibly in 10.3). $\endgroup$
    – murray
    Commented Dec 24, 2015 at 19:53
13
$\begingroup$

RegionPlot[{d[{x, y}, p1, M1] < d[{x, y}, p2, M2], d[{x, y}, p1, M1] > d[{x, y}, p2, M2]}, {x, -4, 4}, {y, -4, 4}, Epilog -> Point[{p1, p2}]] seems to do what you want:

RegionPlot[] example

$\endgroup$
1
  • $\begingroup$ On that note: if you just want to tack on simple graphics primitives (e.g. Point[], Line[]) to your plots, the use of either the Prolog or Epilog options looks slightly neater than using Show[]. $\endgroup$ Commented Feb 6, 2012 at 13:58

Your Answer

By clicking “Post Your Answer”, you agree to our terms of service and acknowledge you have read our privacy policy.

Not the answer you're looking for? Browse other questions tagged or ask your own question.