4
$\begingroup$

Is this a bug, or something going over my head? When using the following code, nothing "special" happens:

ParametricPlot[a {Cos[t], Sin[t]}, {a, 1, 2}, {t, 0, 2 Pi}, 
 Mesh -> None, PlotStyle -> Opacity[0.2]]

it works as expected, one gets this graphic, without any mesh lines:
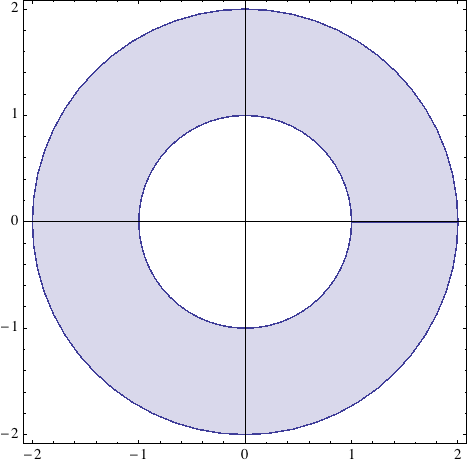
enter image description here

When adding Graphics[] in front of that—as I'd like to Show such a ParametricPlot with some other graphics, I get this:

Show[
 Graphics[],
 ParametricPlot[a {Cos[t], Sin[t]}, {a, 1, 2}, {t, 0, 2 Pi}, 
  Mesh -> None, PlotStyle -> Opacity[0.2]]
 ]

yields:
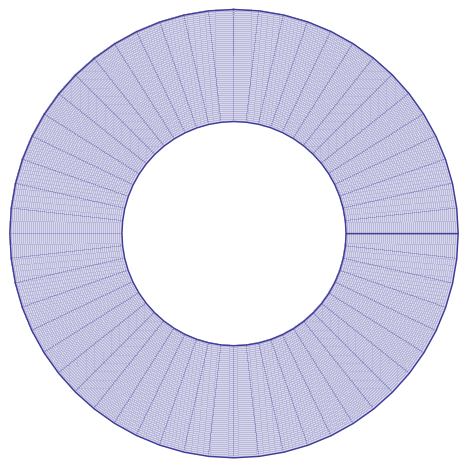
enter image description here

Why do those mesh-lines come up? Are those actually Mesh-lines, as I used Mesh -> None? How can I delete those lines, while still using Show and others Graphics[]?

Thanks for all help!

$\endgroup$
16
  • 1
    $\begingroup$ No, both codes give me the first result. $\endgroup$
    – Kuba
    Commented Dec 1, 2013 at 9:18
  • 1
    $\begingroup$ works ok on V 9.01, windows 7 $\endgroup$
    – Nasser
    Commented Dec 1, 2013 at 9:23
  • 1
    $\begingroup$ No mesh on linux either. $\endgroup$ Commented Dec 1, 2013 at 9:40
  • 1
    $\begingroup$ I'm using 9.0.1.0 on OS X 10.9 - I see the same problem. $\endgroup$ Commented Dec 1, 2013 at 11:31
  • 2
    $\begingroup$ Try Show[Graphics[{}, Method -> {"TransparentPolygonMesh" -> True} ], ParametricPlot[a {Cos[t], Sin[t]}, {a, 1, 2}, {t, 0, 2 Pi}, Mesh -> None, PlotStyle -> Opacity[0.2]]] - see this Q&A for more... $\endgroup$
    – cormullion
    Commented Dec 1, 2013 at 12:01

1 Answer 1

2
$\begingroup$

I can reproduce the problem on V9.0.1 running on OS X. I don't think it's a bug. I think it's the old problem of Show taking its options from its first argument. I say this because reversing the order of the arguments fixes the problem.

Show[
  Graphics[],
  ParametricPlot[a {Cos[t], Sin[t]}, {a, 1, 2}, {t, 0, 2 Pi}, 
    Mesh -> None, PlotStyle -> Opacity[0.2]],
  ImageSize -> Small]

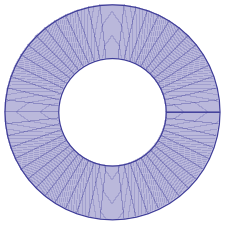
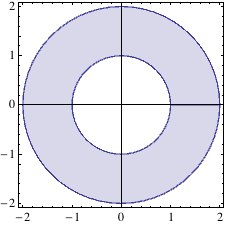
plot

Show[
  ParametricPlot[a {Cos[t], Sin[t]}, {a, 1, 2}, {t, 0, 2 Pi}, 
    Mesh -> None, PlotStyle -> Opacity[0.2]],
  Graphics[],
  ImageSize -> Small]

plot

$\endgroup$
4
  • $\begingroup$ So you are agreeing with what @cormullion essentially observed, too. The problem with changing the order of presentation in Show is that the purpose of setting Opacity in the first place was so that it can be placed on top of a Graphics that comes before the RegionPlot. So changing the order doesn't really seem to be a solution. $\endgroup$
    – Jens
    Commented Apr 28, 2014 at 4:07
  • $\begingroup$ @Jens. Maybe doesn't solve the OP's real problem, but it explains his results. I would advise him to put his graphics in a prolog and eschew Show. $\endgroup$
    – m_goldberg
    Commented Apr 28, 2014 at 4:18
  • $\begingroup$ yes, that sounds like the best route. eschew Show... Gesundheit. $\endgroup$
    – Jens
    Commented Apr 28, 2014 at 4:26
  • $\begingroup$ eschew...Gesundheit... +1 for the lol (and nice answer, of course). $\endgroup$
    – ciao
    Commented Apr 28, 2014 at 6:28

Not the answer you're looking for? Browse other questions tagged or ask your own question.