I edited my question and included the code:
here I make the general definitions for the parametric plots I have to do later (these are simply the definitions of the x and y coordinates of the points in the region, there are no problems here):
ClearAll["Global^*"];

ClearSystemCache[];

eU2[heU2_?NumericQ] = (Sin[heU2])^2/(2 *(1 - Cos[heU2])^2);

zU2[hzU2_?NumericQ] = Cos[hzU2]/(1 - Cos[hzU2]);

hU2end[cU2end_?NumericQ] = ArcCos[(2*cU2end^2 - 1)/(2*cU2end^2 + 1)];

hU2cmbt[cU2cmbt_?NumericQ, oU2cmbt_?NumericQ, eFU2cmbt_?NumericQ] =
2*ArcCos[(Cos[oU2cmbt/2])*E^(-(eFU2cmbt/(2*cU2cmbt^2)))];

hU2cmb[cU2cmb_?NumericQ, eFU2cmb_?NumericQ] =
hU2cmbt[cU2cmb, oU2cmb, eFU2cmb] /. oU2cmb -> hU2end[cU2cmb];

nsU2[cnsU2_?NumericQ, eFnsU2_?NumericQ] =
1 + 2*cnsU2^(-2)*zU2[hU2cmb[cnsU2, eFnsU2]] -
6*cnsU2^(-2)*eU2[hU2cmb[cnsU2, eFnsU2]];

rU2[crU2_?NumericQ, eFrU2_?NumericQ] =
16*crU2^(-2)*eU2[hU2cmb[crU2, eFrU2]];
Having defined these functions, I define a color to be used later:
CoolColorU2 = ColorData["CMYKColors"];
Now I do the parametric plot:
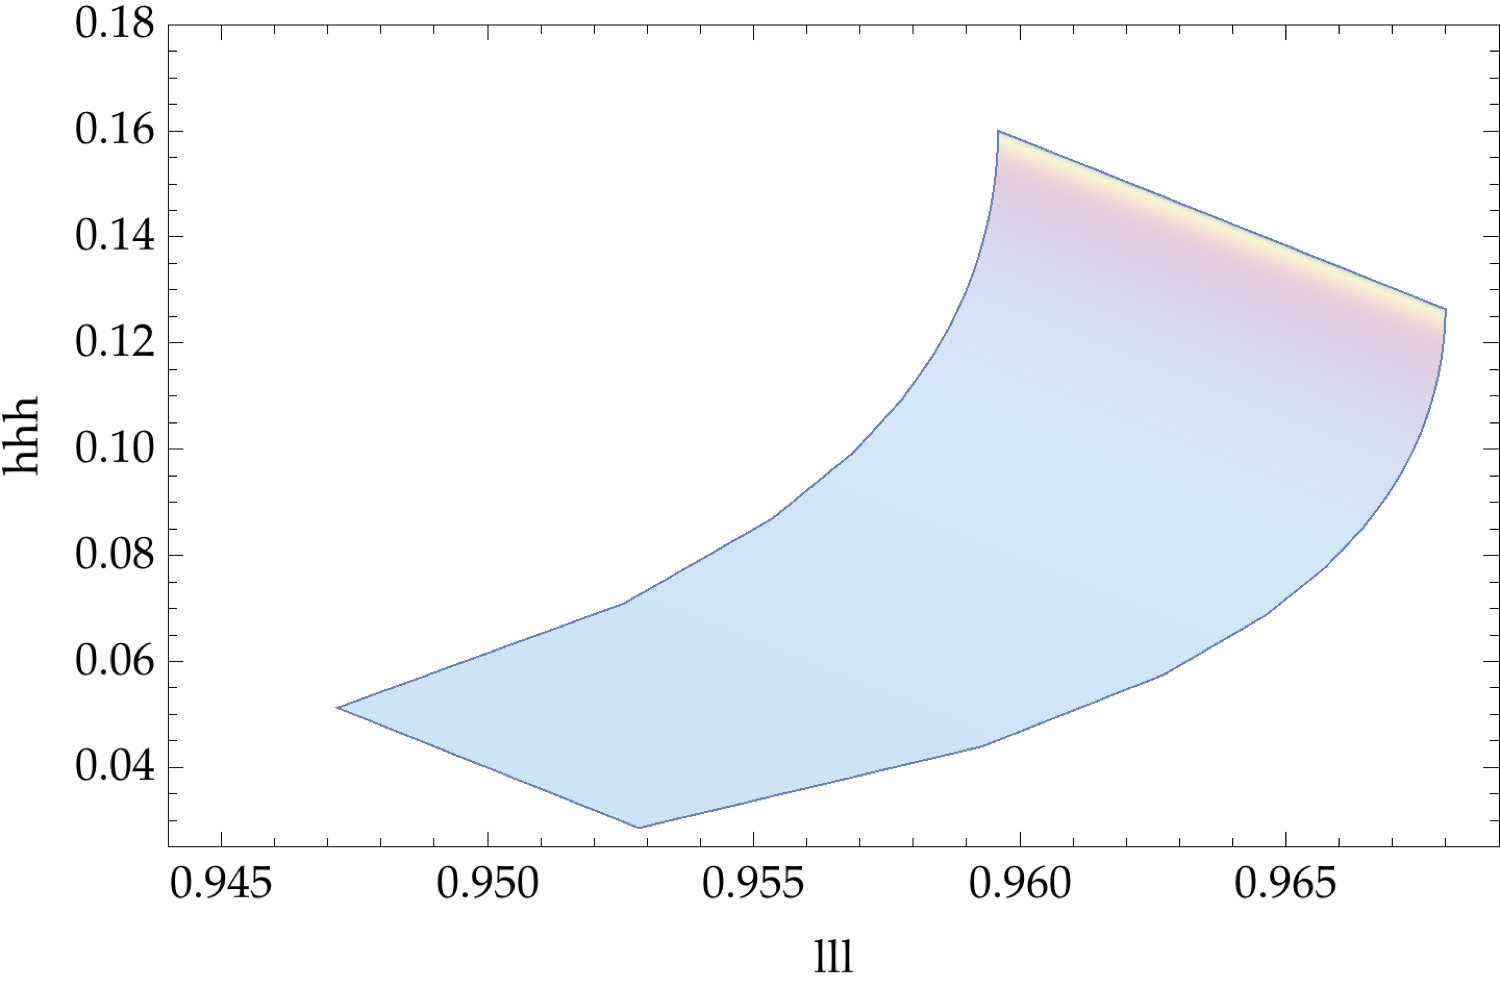
 PlotU2Treh =
 ParametricPlot[
 Evaluate[{nsU2[CCU2Treh, NNU2Treh],
 rU2[CCU2Treh, NNU2Treh]}], {CCU2Treh, 5, 50}, {NNU2Treh, 49, 62},
 PlotRange -> {{944/1000, 969/1000}, {25/1000, 180/1000}},
 AspectRatio -> 1/GoldenRatio,
 ColorFunction ->
 Function[{x, y, CCU2Treh}, Opacity[1/3, CoolColorU2[CCU2Treh]]],
 ColorFunctionScaling -> {True, True, True,
 BoundaryStyle -> None, Axes -> False,
 LabelStyle -> Directive[11, FontFamily -> "Palatino"],
 FrameLabel -> {"lll",
 "hhh"}, WorkingPrecision -> 6,
 PerformanceGoal -> "Quality"]
The problems here are the following:
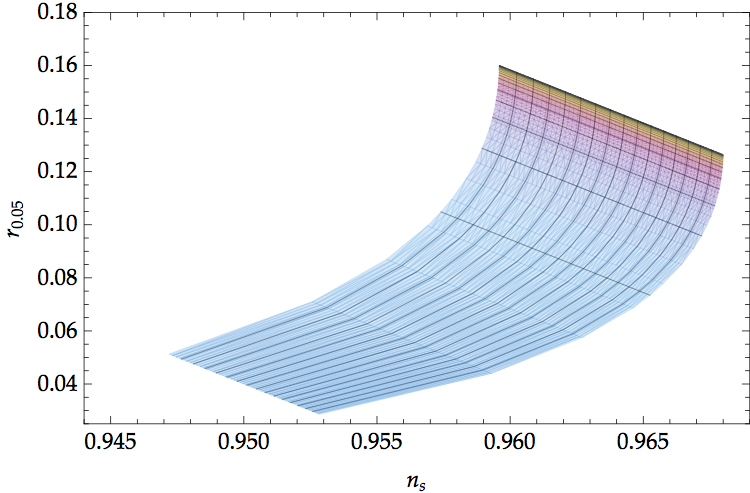
1) when I export this Image in .pdf, I get the result shown in the figure below (.tiff conversion from Mac Preview, cannot upload .pdf)

that is there are some "lines" between the "rectangles" of the underlying mesh, that form a "strange tiling" on my surface.
2) when exporting to .pdf, Mathematica gives me a file of the order of MB (when it doesn't crash upon exporting, that is half of the time). Why so heavy (correction: this seems to be the case only when I add with "Legended" some legends I did with "BarLegend" and "SwatchLegend")?
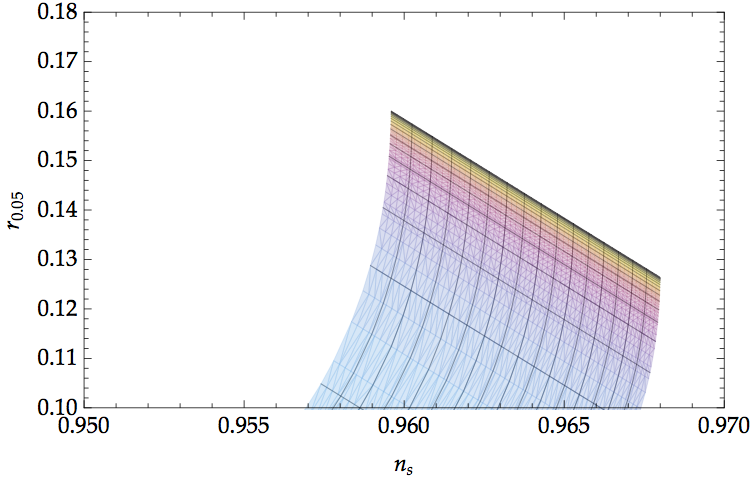
3) when trying to "zoom" with "Show" and "PlotRange" i get the following image (again, converted to .tiff with Preview)

and the "problem" is that the plot seems to "leak out" when encountering the x axis. How can I avoid this?
So in the end there are two questions:
a) why if I plot the first parametric region with a "color gradient" that "strange tiling" appears?
b) why does the image "leak out" from the borders upon zooming in?
Thank you, hope to hear from you soon.
Giovanni
P.S.: Mathematica version: 9.0.0. Laptop: MacBook OS X 10.9.2 Mavericks, 2.2 GHz Intel Core 2 Duo, 4 GB DDR3
EDIT: solved two thirds of the question, last problem remains.
Ok I think I solved the "b)" problem. Going through the docs I saw that for PlotRange settings other than "All", "Full" and "Automatic", the "PlotRangePadding" option is set to none. If I set PlotRange to "All", "Full" or "Automatic", instead, there is a 4% padding. So I think that I just have to add the "PlotRangePadding" option myself.
So, there is only the problem "a)" left: I tried to use
Method->{"TransparentPolygonMesh"->True}
as was suggested in Removing unwanted appearance of underlying mesh and Using transparency in ContourPlot makes mesh visible but when I export the graphic to .pdf, the problem remains.

