14
$\begingroup$

I am trying to export a plot generated by MatrixPlot to PDF but am having problems with the way the exported PDF is rendered.

  mPlot = MatrixPlot[length, 
  Epilog -> {Cyan, 
    MapIndexed[If[#1 != 0, Text[#1, Reverse[#2 - 1/2]]] &, 
     Reverse[number], {2}]}, Mesh -> True, 
  FrameTicks -> {{Table[i, {i, 9}], 
     MapIndexed[{First[#2], regionCodes[[#1]]} &, 
      Table[i, {i, 9}]]}, {Table[i, {i, 9}], 
     MapIndexed[{First[#2], Rotate[regionCodes[[#1]], 90 Degree]} &, 
      Table[i, {i, 9}]]}}, ColorFunctionScaling -> False, 
  PlotRange -> {Min[length], Max[length]}]

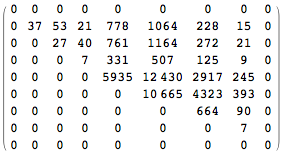
The matrices length (plotted as shades of gray in the figure below), number (shown as the cyan numbers in the figure below), and regionCodes have the following values

length = {{0, 0, 0, 0, 0, 0, 0, 0, 0}, {0, 0.079774, 0.0545131, 
   0.0484267, 0.0614324, 0.0627509, 0.0572262, 0.0424639, 0}, {0, 0, 
   0.0600802, 0.100418, 0.0615561, 0.0737833, 0.0732888, 0.0624553, 
   0}, {0, 0, 0, 0.0740108, 0.0559982, 0.0666054, 0.0749018, 
   0.0493431, 0}, {0, 0, 0, 0, 0.0774839, 0.0554172, 0.0564699, 
   0.0491287, 0}, {0, 0, 0, 0, 0, 0.0798436, 0.0643044, 0.0606039, 
   0}, {0, 0, 0, 0, 0, 0, 0.107009, 0.0713126, 0}, {0, 0, 0, 0, 0, 0, 
   0, 0.0951722, 0}, {0, 0, 0, 0, 0, 0, 0, 0, 0}}
number = {{0, 0, 0, 0, 0, 0, 0, 0, 0}, {0, 37, 53, 21, 778, 1064, 228,
    15, 0}, {0, 0, 27, 40, 761, 1164, 272, 21, 0}, {0, 0, 0, 7, 331, 
   507, 125, 9, 0}, {0, 0, 0, 0, 5935, 12430, 2917, 245, 0}, {0, 0, 0,
    0, 0, 10665, 4323, 393, 0}, {0, 0, 0, 0, 0, 0, 664, 90, 0}, {0, 0,
    0, 0, 0, 0, 0, 7, 0}, {0, 0, 0, 0, 0, 0, 0, 0, 0}}
regionCodes = {"New England", "Middle Atlantic", "East North Central",
   "West North Central", "South Atlantic", "East South Central", 
  "West South Central", "Mountain", "Pacific"}

This is length//MatrixForm

enter image description here

And this is number//MatrixForm

enter image description here

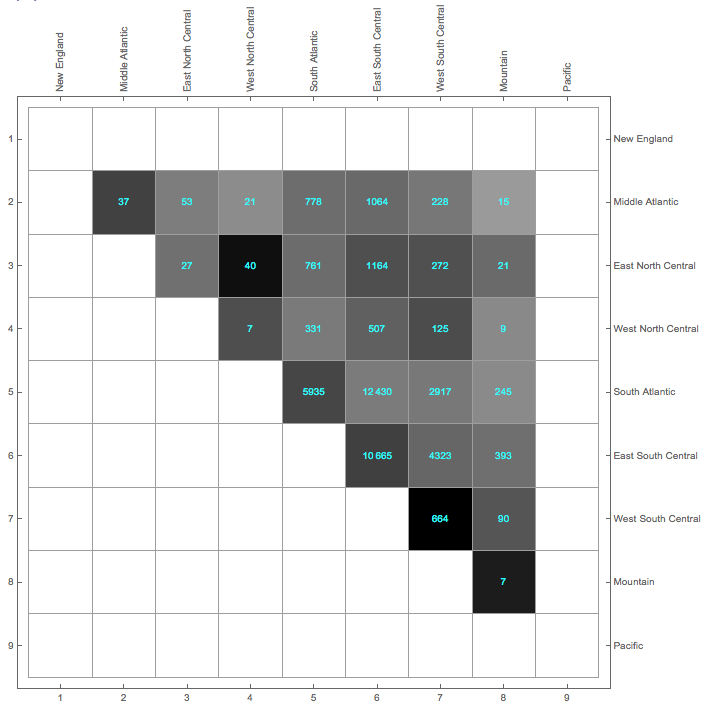
The plot looks like this when shown in Mathematica enter image description here
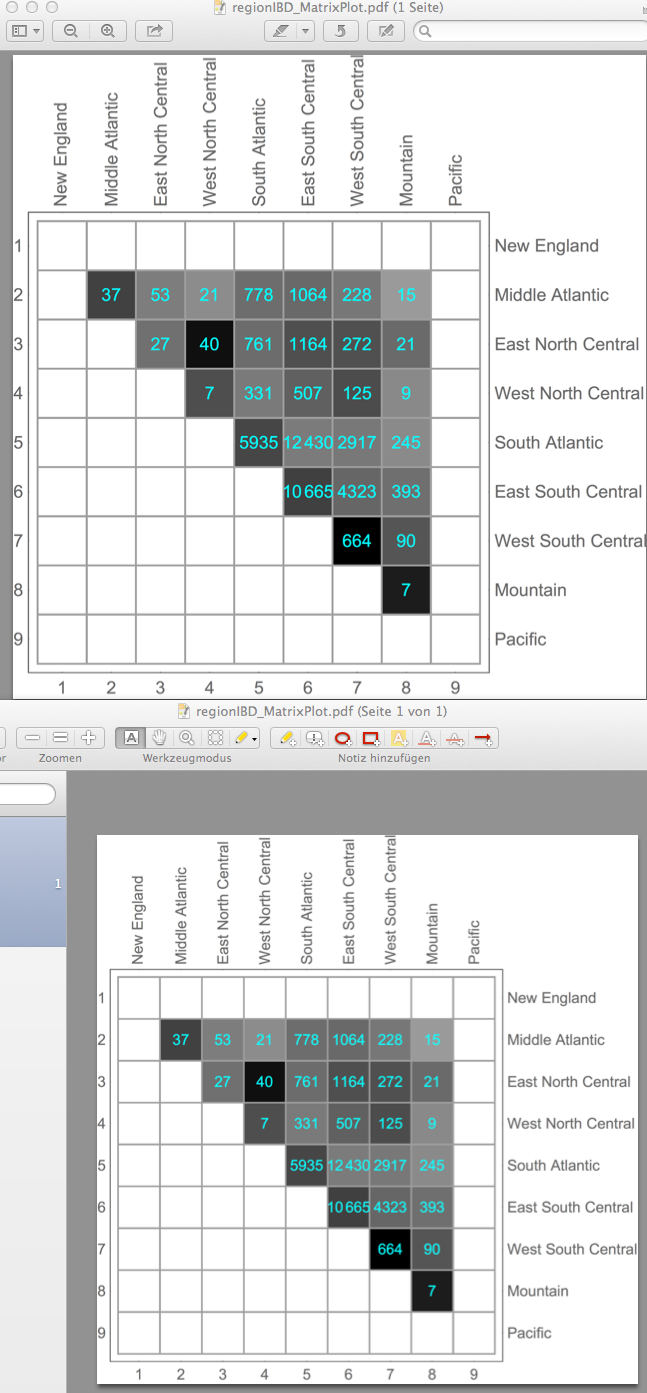
But the exported PDF is rendered as follows (shown in OS X Preview) enter image description here
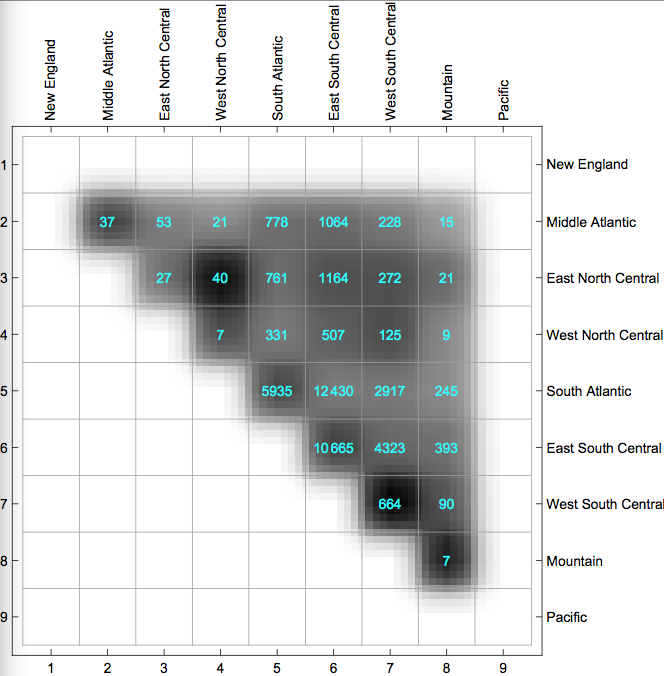
There is a lot of shading and (and anti-aliasing?) going on (it shouldn't!). The only solution I have come up with is to rasterize the plot before exporting it. It does the job, but I don't consider it very elegant.

Export["regionIBD_MatrixPlot.pdf", Rasterize[mPlot, ImageResolution -> 600], ImageSize -> Full]

The funny thing is that if I export it as TIFF, it renders correctly. Is there a way to export the plot as a vector graphics and not as a bitmap?

$\endgroup$
10
  • 1
    $\begingroup$ Are you using version 10? There have been other complaints about PDF export issues in v10 so this may be part of a larger problem. I couldn't test it in v9 since some definitions are not present in the post. $\endgroup$
    – mfvonh
    Commented Aug 26, 2014 at 18:29
  • $\begingroup$ Thanks. Yes, I am using version 10. I'll look up other comments, in case there are already workarounds posted. $\endgroup$
    – darXider
    Commented Aug 26, 2014 at 18:30
  • $\begingroup$ Have a look here there are some nice strategies concerning vectors for simple graphics and/or high resolution rasterized image. And please post code and data, if people are willing to help this is very helpful. $\endgroup$
    – user9660
    Commented Aug 26, 2014 at 18:36
  • $\begingroup$ Thanks @Lou. I've already read that thread. The method suggested there in the first answer (by @Heike) involves rasterizing the image, although when I used "AllowRasterization" -> True, it produced the same shaded(!) PDF, hence my use of Rasterize[]. Oh, and I have posted code and data! Is it not readable? Did I use an incorrect format? $\endgroup$
    – darXider
    Commented Aug 26, 2014 at 18:41
  • $\begingroup$ Code is ok, but if I'm not mistaken regionCodes, length and number can not be copied, are not as data but as image uploaded. People will not write off your data. $\endgroup$
    – user9660
    Commented Aug 26, 2014 at 18:49

3 Answers 3

8
$\begingroup$

To long for a comment, but looks great on "10.0 for Mac OS X x86 (64-bit) (June 29, 2014)" with AR, Preview and Skim. Shut-down and restart your system and try with an alternative viewer ...

enter image description here

Edit

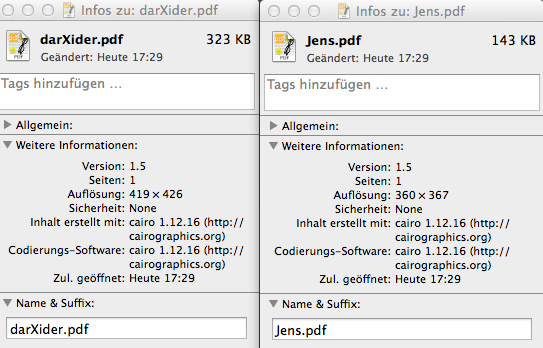
@Jens response is fantastic, right? The procedure improves the resolution dramatically and even reduced the size.

enter image description here

I was able to test both algorithms on iMac & MacBookRetina (Home) and iMac (work). No difference, still the same results. The PDF's I opened on W7 & W8 with AR without significant differences between Mac and W be seen.

I am also "R" user and therefore use X11 and Cairo. On my Mac the Cairo Engine is the PDF Creator (I guess?). I wanted to share this information with the community.

Maybe this Information leads to a new question with even better answers.

$\endgroup$
8
  • $\begingroup$ Oh, cool! Your answer made me think that maybe the problem is indeed in Preview, so I looked at its Preferences and in the PDF tab, there is an option "Smooth test and line art"; unchecking it fixed the issue. Thanks a lot! $\endgroup$
    – darXider
    Commented Aug 26, 2014 at 19:29
  • $\begingroup$ You are most welcome, to check the settings and preferences is always a good thing :) $\endgroup$
    – user9660
    Commented Aug 26, 2014 at 19:35
  • $\begingroup$ True! I just tried Adobe Acrobat, and it does the same weird smoothing/shading (and I haven't been able to fix it yet!). $\endgroup$
    – darXider
    Commented Aug 26, 2014 at 19:37
  • $\begingroup$ @darXider You should upvote Lou's answer :) $\endgroup$
    – mfvonh
    Commented Aug 26, 2014 at 20:33
  • $\begingroup$ i tried, really, but i have less than 15 reputations, and it prevented me! sorry, but i'm only a n00b here ;) $\endgroup$
    – darXider
    Commented Aug 26, 2014 at 20:34
7
$\begingroup$

I see this problem too, and I found it is fixed in Skim and Preview by using this function:

rasterTrick[plot_] := 
 Show[plot, 
  Prolog -> {Opacity[0], Texture[{{{0, 0, 0, 0}}}], 
    VertexTextureCoordinates -> {{0, 0}, {1, 0}, {1, 1}}, 
    Polygon[{{0, 0}, {.1, 0}, {.1, .1}}]}]

Export["regionIBD_MatrixPlot1.pdf", mPlot // rasterTrick]

The convenience function rasterTrick is from my answer to Avoiding grid lines inside filled area in RegionPlot exported as PDF.

$\endgroup$
5
  • $\begingroup$ fantastic! it fixes things in Preview, Skim, and Adobe Reader. $\endgroup$
    – darXider
    Commented Aug 27, 2014 at 15:10
  • $\begingroup$ I tend to testify this answer is Jens-sastic. $\endgroup$
    – user9660
    Commented Aug 27, 2014 at 16:23
  • $\begingroup$ @Lou New dictionary item - "jens-sastic (adj.): awkward and painful solution to a problem that shouldn't exist in the first place" $\endgroup$
    – Jens
    Commented Aug 27, 2014 at 18:32
  • $\begingroup$ I just remembered that I had asked a closely related question myself in 2012, and that this answer also applies there: Color ramp banding in PDFKit when exporting Raster image Inset to PDF. $\endgroup$
    – Jens
    Commented Aug 27, 2014 at 18:45
  • $\begingroup$ Your solution works for me as well, but the exported graphic is still a bit more fuzzy than if I save it as png for example. Is there a way to improve the level of fuzzyness based on your code (even if it increases the size of the pdf)? $\endgroup$
    – Sulli
    Commented Nov 18, 2014 at 13:16
5
$\begingroup$

A similar problem is being discussed in this thread. I'll copy my method of going around it here, in case someone stumbles on this thread through searches.

I have been saving a file wit MatrixPlot (using Save As...-> PDF), and have encountered a similar problem.

Turns out, MatrixPlot (and similar) data is being exported as a bitmap, which gets blurred in Adobe Reader 9 (which I have), even if "Smooth line art" and "Smooth images" is unchecked in preferences. The PDF showed fine in Okular, but that is probably just the lack of smoothing in that viewer.

I have found the solution on Inkscape forums. Open the PDF file in a text editor, and locate the following line:

/Interpolate true

Change it to the following:

/Interpolate false

Et voilà! The problem is solved, and the PDF shows fine in Adobe Reader, without blurring.

$\endgroup$
1
  • $\begingroup$ thanks for the information! that's very useful. $\endgroup$
    – darXider
    Commented Nov 25, 2014 at 23:49

Your Answer

By clicking “Post Your Answer”, you agree to our terms of service and acknowledge you have read our privacy policy.

Not the answer you're looking for? Browse other questions tagged or ask your own question.