Bug introduced in 9.0 and fixed in 10.0
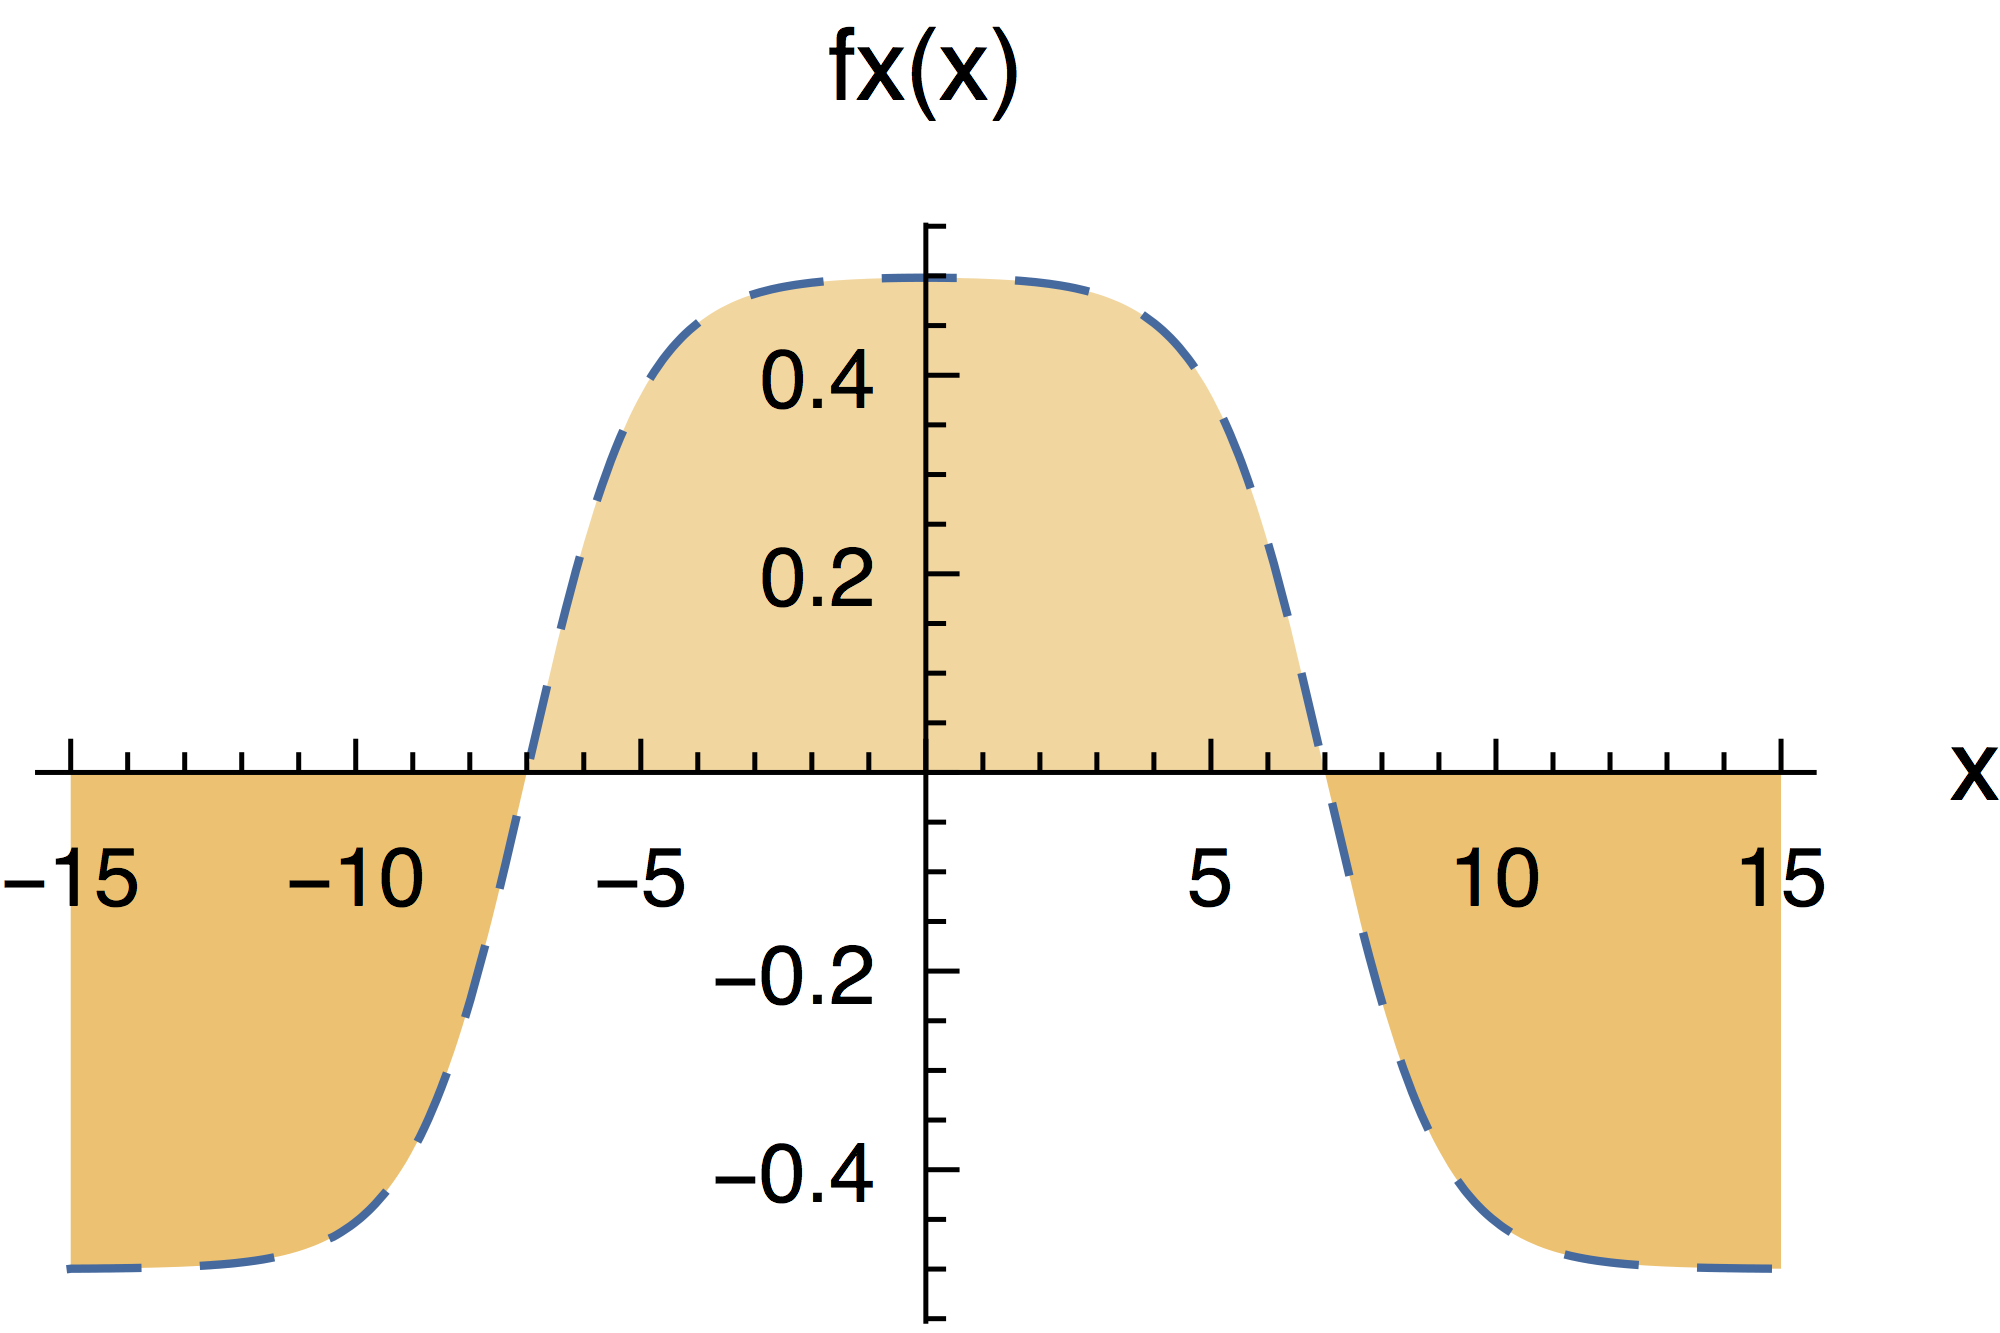
I observed some strange behaviour when plotting a function with filling.
The code is as follows:
fx[x_] := 1/(Exp[-x - 7] + 1) + 1/(Exp[x - 7] + 1) - 3/2

blue = RGBColor[17.6/100, 41.6/100, 63.1/100];
yellow = RGBColor[96.9/100, 68.6/100, 20.8/100];

u10 = Plot[fx[x], {x, -15, 15}, PlotRange -> All, AxesLabel -> {"x", "fx(x)"}, PlotStyle -> Directive[Dashed, AbsoluteThickness[0.5], blue], Filling -> {1 -> {Axis, {Directive[Opacity[0.75], yellow], Directive[Opacity[0.5], yellow]}}}]

u11 = Show[u10, Frame -> False, Axes -> True,  AxesStyle -> Directive[AbsoluteThickness[0.3], 6, FontFamily -> "Helvetica"], ImageSize -> 120, TicksStyle -> Directive[AbsoluteThickness[0.3], 5, FontFamily -> "Helvetica"]]

Export[FileNameJoin[{HomeDirectory[],"u11.pdf"}], u11]
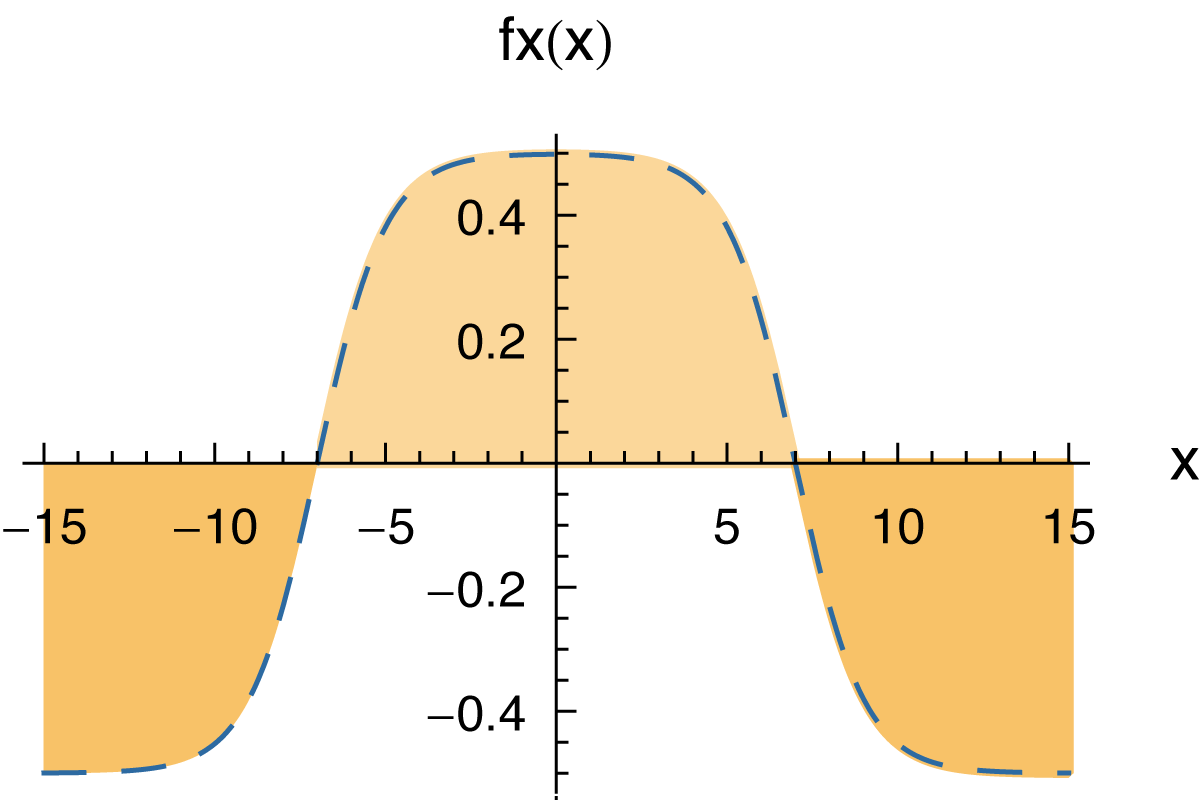
The problem with generated image is that only leftmost filling area is properly rendered. The central and the rightmost areas go slightly beyond the borders. The mismatch is not large, around one line-width, but visible. I attach below the generated image converted from pdf to png with 1200pt resolution.

Notice
This is not an artefact of pdf viewers: Adobe Acrobat 8 Professional, Adobe Reader X (Windows); Preview, Adobe Illustrator CS6, Adobe Acrobat 10.1.9 (Mac) consistently produce the same picture. Preview generates some more artefacts, however, it is not important in this context.
The problem seems to be specific for Mathematica 9.0.1 for Mac and Win 7 (64 bit). I can confirm that the problem does not arise for Mathematica 6.0.1 for Win XP. Other users indicate proper rendering with versions 7 and 8.
Details
The effect does not depend on the line-style (full, dotted, etc.), on the opacity, plot-type (frame vs axes, list plot vs. plot). Reducing the line-width reduces the undesired effect, however, it is not an option for me (as explained in this post).
I would appreciate any suggestions on how to fix the problem.


Desktop...directory will not work (again) with all systems. $\endgroup$