I find that the package SciDraw is suitable for preparing the figure in the thesis. When I use it to plot the line, it works well. For example
<< SciDraw`
Figure[FigurePanel[{FigGraphics[Plot[Sin[10 x],{x,0,1}]]},
  XPlotRange -> {0, 1},
  XTicks -> LinTicks[0, 1, 0.2, 2],
  YPlotRange -> {0, 1},
  YTicks -> LinTicks[0, 1, 0.2, 2],
  YExtendRange -> 0.04,
  FontFamily -> "Times New Roman",
  FontSize -> 14,
  XFrameLabel -> X,
  XTickTextNudge -> -5,
  YTickTextNudge -> {-5, 0},
  YFrameLabel -> Y
  ],
 CanvasUnits -> Centimeter,
 CanvasSize -> {10, 10},
 CanvasMargin -> {{1.5, 0.5}, {1.5, 0.5}}]
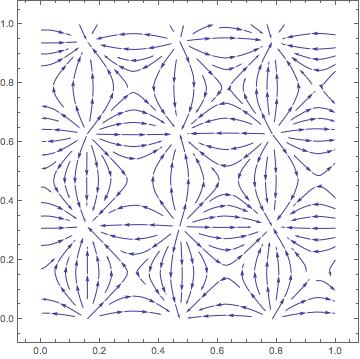
I also want to use it to produce the streamplot, but it doesn't work well: the background of the figure is in the same color, and no line can be identified. For example
<< SciDraw`
grad = -Grad[Sin[10 x] Cos[10 y], {x, y}];
plot = StreamPlot[grad, {x, 0, 1}, {y, 0, 1}]

Figure[FigurePanel[{FigGraphics[plot]},
  XPlotRange -> {0, 1},
  XTicks -> LinTicks[0, 1, 0.2, 2],
  YPlotRange -> {0, 1},
  YTicks -> LinTicks[0, 1, 0.2, 2],
  YExtendRange -> 0.04,
  FontFamily -> "Times New Roman",
  FontSize -> 14,
  XFrameLabel -> X,
  XTickTextNudge -> -5,
  YTickTextNudge -> {-5, 0},
  YFrameLabel -> Y
  ],
 CanvasUnits -> Centimeter,
 CanvasSize -> {10, 10},
 CanvasMargin -> {{1.5, 0.5}, {1.5, 0.5}}]


