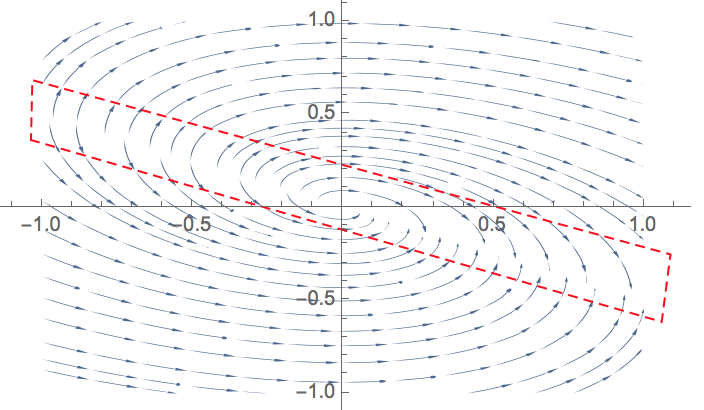
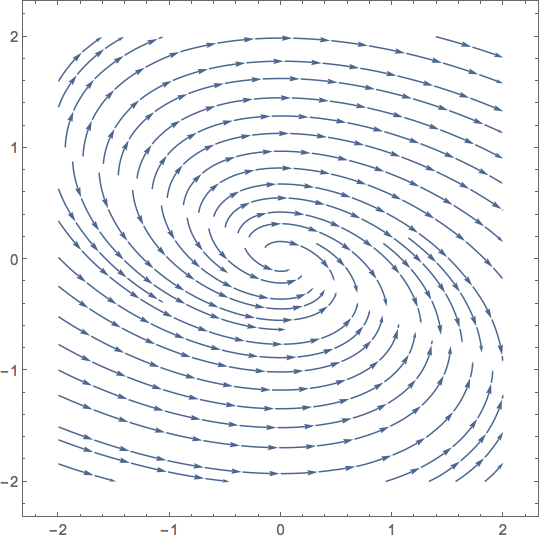
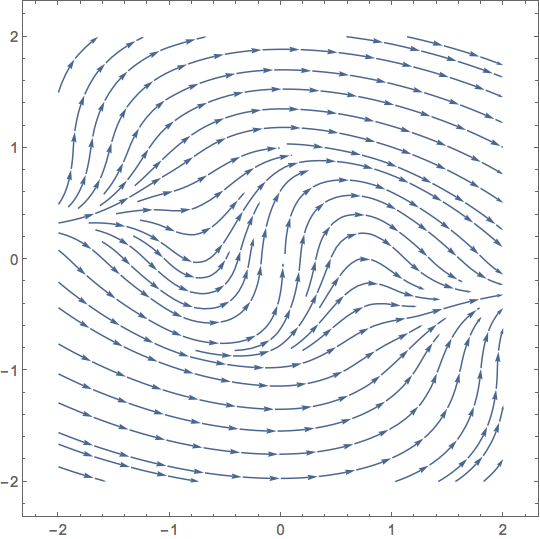
I will like to know how StreamPlot finds its way around singular/indeterminate values. Actually, I was thinking of using ListStreamPlot to generate a phase portrait for a huge dataset that contains some singularities. To illustrate my point here is a simple example that was previously dealt with in this post
Clear[f]
f[x_, y_] := {1, x/(-x - 2 y)}
StreamPlot[f[x, y], {x, -2, 2}, {y, -2, 2}, Frame -> False,
Axes -> True, AspectRatio -> 1/GoldenRatio,StreamStyle -> "PinDart"]
Obviously there was a singularity at y=-x/2. However, StreamPlot was still able to generate a plot. Dataset showed that there are singular values in the range of plot (except that StreamPlot seemed to have used some subtle methods to generate the values plotted while avoiding values associated withy=-x/2) - though the discontinuity can be seen in the plot.

exampleDataSet=Table[f[x, y], {x, -2, 2}, {y, -2, 2}]//N produces

{{{1., -0.333333}, {1., -0.5}, {1., -1.}, {1., ComplexInfinity}, {1., 1.}},
{{1., -0.2}, {1., -0.333333}, {1., -1.}, {1., 1.}, {1., 0.333333}},
{{1., 0.}, {1., 0.}, {1., Indeterminate}, {1., 0.}, {1., 0.}},
{{1., 0.333333}, {1., 1.}, {1., -1.}, {1., -0.333333}, {1., -0.2}},
{{1., 1.}, {1., ComplexInfinity}, {1., -1.}, {1., -0.5}, {1., -0.333333}}}
ListStreamPlot[exampleDataSet] will generate a blank plot.
In my situation, the singularities have special physical meaning in the model and should be captured on the phase plot. Interpolating the data won't work either since there are some singularities involved. ListStreamPlot won't work with exampleDataSet. Removing the singular values will change the problem and the phase portrait completely.
I am thinking if I know how StreamPlot works its way around those singular values, I can possibly adapt the knowledge to ListStreamPlot or any other phase plot options in Mathematica.
How do I go about generating a phase plot with a dataset (containing singularities) while capturing those singularities in the plot? Are there alternatives that I could explore? Any help will be greatly appreciated.


StreamPlotjust avoids singularities. WhenNDSolvestops due to stiffness, it either keeps or rejects the stream lines, perhaps depending on length. $\endgroup$