2
$\begingroup$

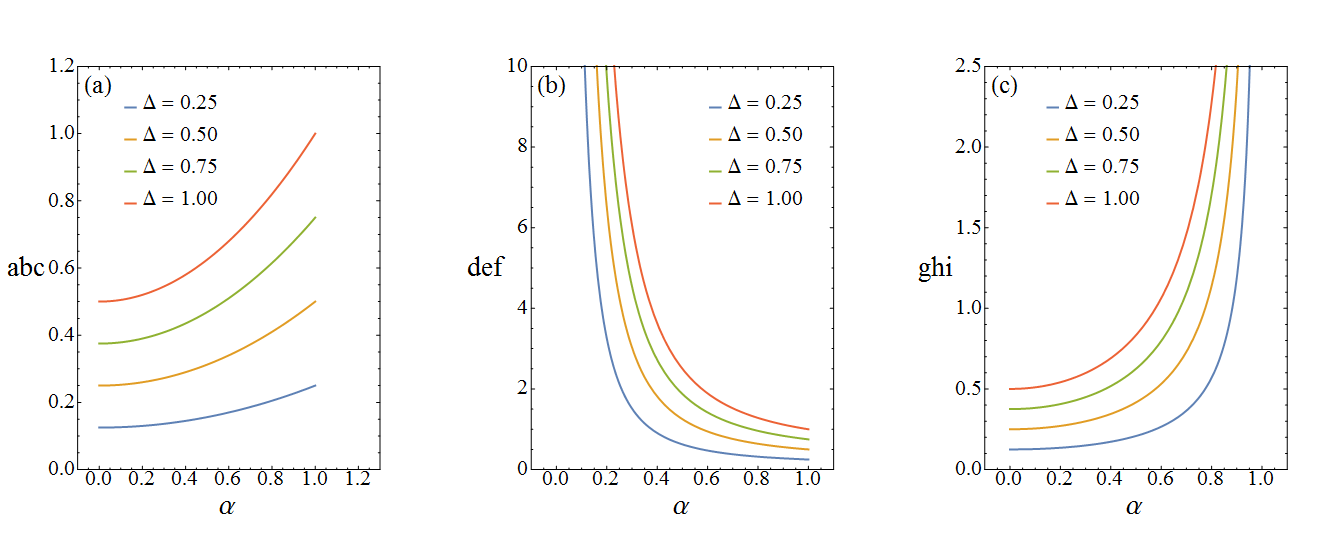
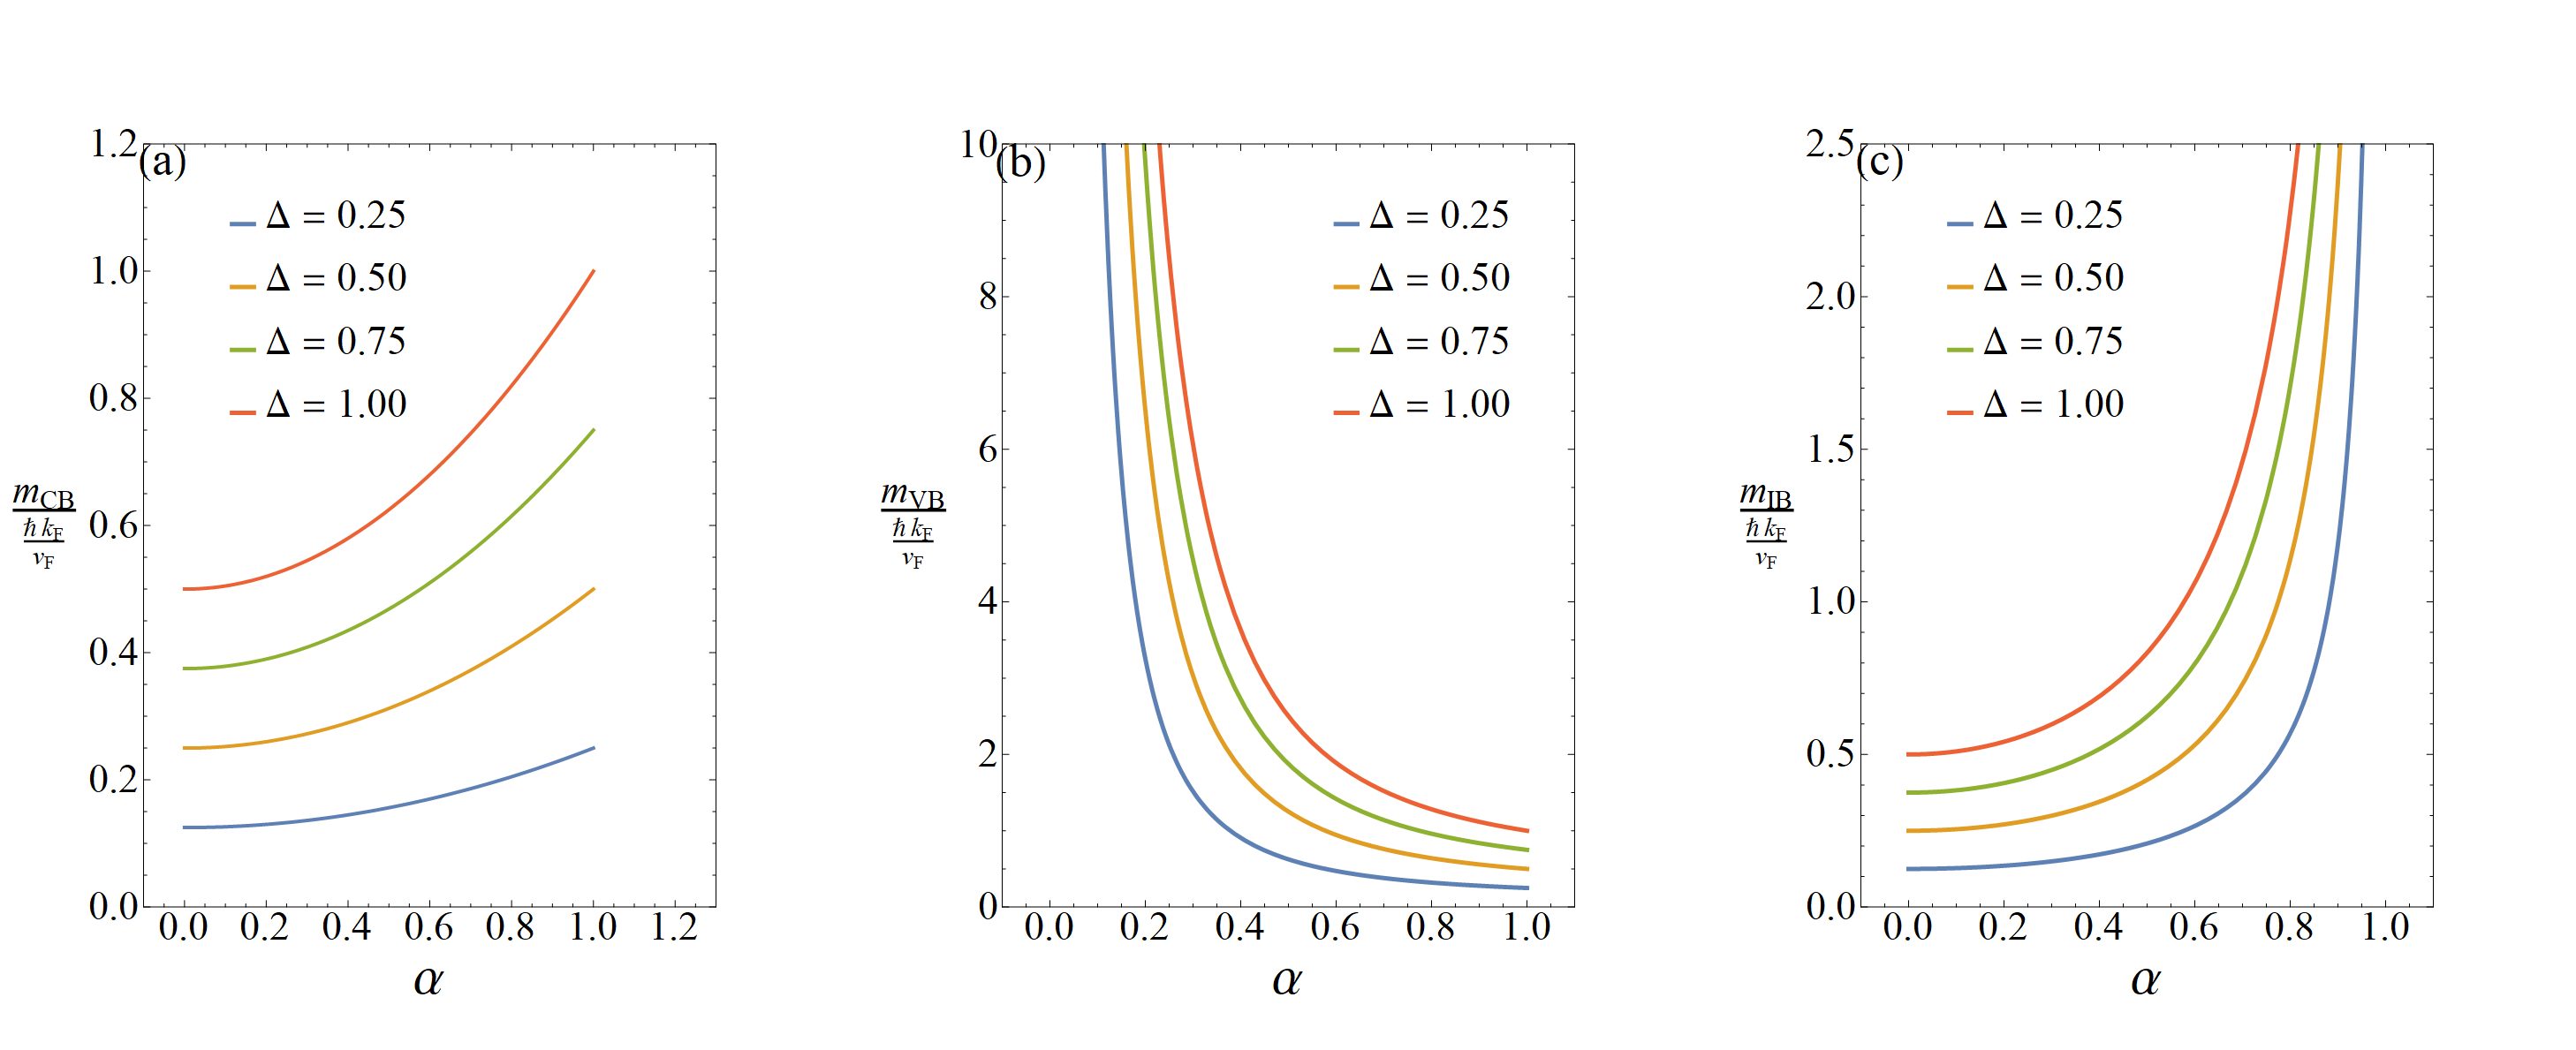
I created this plot using SciDraw. I like everything about it EXCEPT the labels of the figure panels (a), (b), (c). They overlap with the frame. Can I move them a bit inward, just a smidge down in the y-direction and to the right in the x-direction?

mc[\[Alpha]_, \[CapitalDelta]_] := ((1 + \[Alpha]^2) \
\[CapitalDelta])/2; 
mv[\[Alpha]_, \[CapitalDelta]_] := ((1 + \[Alpha]^2) \
\[CapitalDelta])/(2 \[Alpha]^2); 
mi[\[Alpha]_, \[CapitalDelta]_] := ((1 + \[Alpha]^2) \
\[CapitalDelta])/(2 (1 - \[Alpha]^2));
massPLOTS = 
 Figure[Multipanel[{FigurePanel[{FigGraphics[
       Plot[{mc[\[Alpha], 0.25], mc[\[Alpha], 0.5], 
         mc[\[Alpha], 0.75], mc[\[Alpha], 1]}, {\[Alpha], 0, 1}, 
        PlotStyle -> Thickness[0.000025]]], 
      FigLabel[
       LineLegend[{Directive[RGBColor[0.368417, 0.506779, 0.709798], 
          AbsoluteThickness[3.5]], 
         Directive[RGBColor[0.880722, 0.611041, 0.142051], 
          AbsoluteThickness[3.5]], 
         Directive[RGBColor[0.560181, 0.691569, 0.194885], 
          AbsoluteThickness[3.5]], 
         Directive[RGBColor[0.922526, 0.385626, 0.20917], 
          AbsoluteThickness[3.5]]}, {Text[
          Style["\[CapitalDelta] = 0.25", 30, FontFamily -> "Times"]],
          Text[Style["\[CapitalDelta] = 0.50", 30, 
           FontFamily -> "Times"]], 
         Text[Style["\[CapitalDelta] = 0.75", 30, 
           FontFamily -> "Times"]], 
         Text[Style["\[CapitalDelta] = 1.00", 30, 
           FontFamily -> "Times"]]}], Point -> Scaled[{.05, .95}], 
       TextOffset -> {-1.5, 1}]}, {1, 1}, XPlotRange -> {-0.1, 1.3}, 
     YPlotRange -> {0, 1.2}, 
     FrameLabel -> {Text[
        Style["\[Alpha]", 40, FontFamily -> "Times"]], 
       Rotate[Text[Style["\!\(\*FractionBox[SubscriptBox[
StyleBox[\"m\",\nFontSlant->\"Italic\"], \"CB\"], FractionBox[
RowBox[{\"\[HBar]\", \" \", SubscriptBox[
StyleBox[\"k\",\nFontSlant->\"Italic\"], \"F\"]}], SubscriptBox[
StyleBox[\"v\",\nFontSlant->\"Italic\"], \"F\"]]]\)", 40, 
          FontFamily -> "Times"]], -90 Degree]}]; 
    FigurePanel[{FigGraphics[
       Plot[{mv[\[Alpha], 0.25], mv[\[Alpha], 0.5], 
         mv[\[Alpha], 0.75], mv[\[Alpha], 1]}, {\[Alpha], 0, 1}, 
        PlotStyle -> Thickness[0.000025]]], 
      FigLabel[
       LineLegend[{Directive[RGBColor[0.368417, 0.506779, 0.709798], 
          AbsoluteThickness[3.5]], 
         Directive[RGBColor[0.880722, 0.611041, 0.142051], 
          AbsoluteThickness[3.5]], 
         Directive[RGBColor[0.560181, 0.691569, 0.194885], 
          AbsoluteThickness[3.5]], 
         Directive[RGBColor[0.922526, 0.385626, 0.20917], 
          AbsoluteThickness[3.5]]}, {Text[
          Style["\[CapitalDelta] = 0.25", 30, FontFamily -> "Times"]],
          Text[Style["\[CapitalDelta] = 0.50", 30, 
           FontFamily -> "Times"]], 
         Text[Style["\[CapitalDelta] = 0.75", 30, 
           FontFamily -> "Times"]], 
         Text[Style["\[CapitalDelta] = 1.00", 30, 
           FontFamily -> "Times"]]}], Point -> Scaled[{.05, .95}], 
       TextOffset -> {-4, 1}]}, {1, 2}, XPlotRange -> {-0.1, 1.1}, 
     YPlotRange -> {0, 10}, 
     FrameLabel -> {Text[
        Style["\[Alpha]", 40, FontFamily -> "Times"]], 
       Rotate[Text[Style["\!\(\*FractionBox[SubscriptBox[
StyleBox[\"m\",\nFontSlant->\"Italic\"], \"VB\"], FractionBox[
RowBox[{\"\[HBar]\", \" \", SubscriptBox[
StyleBox[\"k\",\nFontSlant->\"Italic\"], \"F\"]}], SubscriptBox[
StyleBox[\"v\",\nFontSlant->\"Italic\"], \"F\"]]]\)", 40, 
          FontFamily -> "Times"]], -90 Degree]}];
    FigurePanel[{FigGraphics[
       Plot[{mi[\[Alpha], 0.25], mi[\[Alpha], 0.5], 
         mi[\[Alpha], 0.75], mi[\[Alpha], 1]}, {\[Alpha], 0, 0.99}, 
        PlotStyle -> Thickness[0.000025]]], 
      FigLabel[
        LineLegend[{Directive[RGBColor[0.368417, 0.506779, 0.709798], 
           AbsoluteThickness[3.5]], 
          Directive[RGBColor[0.880722, 0.611041, 0.142051], 
           AbsoluteThickness[3.5]], 
          Directive[RGBColor[0.560181, 0.691569, 0.194885], 
           AbsoluteThickness[3.5]], 
          Directive[RGBColor[0.922526, 0.385626, 0.20917], 
           AbsoluteThickness[3.5]]}, {Text[
           Style["\[CapitalDelta] = 0.25", 30, 
            FontFamily -> "Times"]], 
          Text[Style["\[CapitalDelta] = 0.50", 30, 
            FontFamily -> "Times"]], 
          Text[Style["\[CapitalDelta] = 0.75", 30, 
            FontFamily -> "Times"]], 
          Text[Style["\[CapitalDelta] = 1.00", 30, 
            FontFamily -> "Times"]]}], Point -> Scaled[{.05, .95}], 
        TextOffset -> {-1.5, 1}];}, {1, 3}, XPlotRange -> {-0.1, 1.1},
      YPlotRange -> {0, 2.5}, 
     FrameLabel -> {Text[
        Style["\[Alpha]", 40, FontFamily -> "Times"]], 
       Rotate[Text[Style["\!\(\*FractionBox[SubscriptBox[
StyleBox[\"m\",\nFontSlant->\"Italic\"], \"IB\"], FractionBox[
RowBox[{\"\[HBar]\", \" \", SubscriptBox[
StyleBox[\"k\",\nFontSlant->\"Italic\"], \"F\"]}], SubscriptBox[
StyleBox[\"v\",\nFontSlant->\"Italic\"], \"F\"]]]\)", 40, 
          FontFamily -> "Times"]], -90 Degree]}];}, 
   Dimensions -> {1, 3}, XPanelGaps -> 0.5, ShowFrameLabel -> True, 
   ShowTickLabels -> True, FontSize -> 35], TextPadding -> True, 
  CanvasSize -> {24, 8}, CanvasMargin -> 1.5]

enter image description here

$\endgroup$

1 Answer 1

1
$\begingroup$

PanelLetterPosition option for the FigurePanel will do it.

enter image description here

TL/DR;

I couldn't get the y-axes labels to behave so I simplified them. After correcting a fair amount of missing\,

mc[\[Alpha]_, \[CapitalDelta]_] := ((1 + \[Alpha]^2) \[CapitalDelta])/
  2; mv[\[Alpha]_, \[CapitalDelta]_] := ((1 + \[Alpha]^2) \
\[CapitalDelta])/(2 \[Alpha]^2); 
mi[\[Alpha]_, \[CapitalDelta]_] := ((1 + \[Alpha]^2) \
\[CapitalDelta])/(2 (1 - \[Alpha]^2)); massPLOTS = 
 Figure[Multipanel[{FigurePanel[{FigGraphics[
       Plot[{mc[\[Alpha], 0.25], mc[\[Alpha], 0.5], 
         mc[\[Alpha], 0.75], mc[\[Alpha], 1]}, {\[Alpha], 0, 1}, 
        PlotStyle -> Thickness[0.000025]]], 
      FigLabel[
       LineLegend[{Directive[RGBColor[0.368417, 0.506779, 0.709798], 
          AbsoluteThickness[3.5]], 
         Directive[RGBColor[0.880722, 0.611041, 0.142051], 
          AbsoluteThickness[3.5]], 
         Directive[RGBColor[0.560181, 0.691569, 0.194885], 
          AbsoluteThickness[3.5]], 
         Directive[RGBColor[0.922526, 0.385626, 0.20917], 
          AbsoluteThickness[3.5]]}, {Text[
          Style["\[CapitalDelta] = 0.25", 30, FontFamily -> "Times"]],
          Text[Style["\[CapitalDelta] = 0.50", 30, 
           FontFamily -> "Times"]], 
         Text[Style["\[CapitalDelta] = 0.75", 30, 
           FontFamily -> "Times"]], 
         Text[Style["\[CapitalDelta] = 1.00", 30, 
           FontFamily -> "Times"]]}], Point -> Scaled[{.05, .95}], 
       TextOffset -> {-1.5, 1}]}, {1, 1}, XPlotRange -> {-0.1, 1.3}, 
     YPlotRange -> {0, 1.2}, PanelLetterPosition -> 30, 
     FrameLabel -> {Text[
        Style["\[Alpha]", 40, FontFamily -> "Times"]], 
       Rotate[Text[
         Style["abc", 40, FontFamily -> "Times"]], -90 Degree]}]; 
    FigurePanel[{FigGraphics[
       Plot[{mv[\[Alpha], 0.25], mv[\[Alpha], 0.5], 
         mv[\[Alpha], 0.75], mv[\[Alpha], 1]}, {\[Alpha], 0, 1}, 
        PlotStyle -> Thickness[0.000025]]], 
      FigLabel[
       LineLegend[{Directive[RGBColor[0.368417, 0.506779, 0.709798], 
          AbsoluteThickness[3.5]], 
         Directive[RGBColor[0.880722, 0.611041, 0.142051], 
          AbsoluteThickness[3.5]], 
         Directive[RGBColor[0.560181, 0.691569, 0.194885], 
          AbsoluteThickness[3.5]], 
         Directive[RGBColor[0.922526, 0.385626, 0.20917], 
          AbsoluteThickness[3.5]]}, {Text[
          Style["\[CapitalDelta] = 0.25", 30, FontFamily -> "Times"]],
          
         Text[Style["\[CapitalDelta] = 0.50", 30, 
           FontFamily -> "Times"]], 
         Text[Style["\[CapitalDelta] = 0.75", 30, 
           FontFamily -> "Times"]], 
         Text[Style["\[CapitalDelta] = 1.00", 30, 
           FontFamily -> "Times"]]}], Point -> Scaled[{.05, .95}], 
       TextOffset -> {-4, 1}]}, {1, 2}, XPlotRange -> {-0.1, 1.1}, 
     YPlotRange -> {0, 10}, PanelLetterPosition -> 30, 
     FrameLabel -> {Text[
        Style["\[Alpha]", 40, FontFamily -> "Times"]], 
       Rotate[Text[
         Style["def", 40, FontFamily -> "Times"]], -90 Degree]}];
    FigurePanel[{
      FigGraphics[
       Plot[{mi[\[Alpha], 0.25], mi[\[Alpha], 0.5], 
         mi[\[Alpha], 0.75], mi[\[Alpha], 1]},
        {\[Alpha], 0, 0.99}, PlotStyle -> Thickness[0.000025]
        ]
       ],
      FigLabel[
        LineLegend[
         {
          
          Directive[RGBColor[0.368417, 0.506779, 0.709798], 
           AbsoluteThickness[3.5]],
          
          Directive[RGBColor[0.880722, 0.611041, 0.142051], 
           AbsoluteThickness[3.5]],
          
          Directive[RGBColor[0.560181, 0.691569, 0.194885], 
           AbsoluteThickness[3.5]],
          
          Directive[RGBColor[0.922526, 0.385626, 0.20917], 
           AbsoluteThickness[3.5]]
          },
         {
          
          Text[Style["\[CapitalDelta] = 0.25", 30, 
            FontFamily -> "Times"]],
          
          Text[Style["\[CapitalDelta] = 0.50", 30, 
            FontFamily -> "Times"]],
          
          Text[Style["\[CapitalDelta] = 0.75", 30, 
            FontFamily -> "Times"]],
          
          Text[Style["\[CapitalDelta] = 1.00", 30, 
            FontFamily -> "Times"]]
          }
         ],
        Point -> Scaled[{.1, .95}],
        TextOffset -> {-1.5, 1}
        ];
      }, {1, 3},
     XPlotRange -> {-0.1, 1.1},
     YPlotRange -> {0, 2.5},
     PanelLetterPosition -> 30,
     FrameLabel -> {Text[Style["\[Alpha]", 40, FontFamily -> "Times"]],
       Rotate[
        Text[Style["ghi", 40, FontFamily -> "Times"]], -90 Degree]}
     ];
    },
   Dimensions -> {1, 3},
   XPanelGaps -> 0.5,
   ShowFrameLabel -> True,
   ShowTickLabels -> True, FontSize -> 35
   ],
  TextPadding -> True,
  CanvasSize -> {24, 8},
  CanvasMargin -> 1.5]
$\endgroup$
2
  • $\begingroup$ Perfect solution. Thanks! "PanelLetterPosition" is exactly what was needed. The convoluted y-axis labels are problem specific. Not sure what TL/DR refers to? $\endgroup$ Commented Oct 13, 2021 at 10:50
  • $\begingroup$ TL/DR; means (too long don't read): This is to warn the casual visitors that what follows is not immediately important for most. This section was specifically addressed to you and those who are interested in SciDraw. Thanks for the accept. $\endgroup$
    – Syed
    Commented Oct 13, 2021 at 12:14

Your Answer

By clicking “Post Your Answer”, you agree to our terms of service and acknowledge you have read our privacy policy.

Not the answer you're looking for? Browse other questions tagged or ask your own question.