9
$\begingroup$

It seems callout is only for plots and not for graphics :(

DynamicGeoGraphics[{Polygon[
   Entity["City", {"Cambridge", "Massachusetts", "UnitedStates"}]], 
  Callout[GeoMarker[
    Interpreter["StreetAddress"][
     "14 James Way, Cambridge MA"]], "Hi"]}]

What is the preferred way to do styled callouts in geographics?

Also is there any way to get satellite image view instead of maps? Perhaps hooking up to the google maps api?

$\endgroup$
3
  • 3
    $\begingroup$ This is still not supported in v11.2. $\endgroup$
    – user5601
    Commented Sep 18, 2017 at 17:58
  • 4
    $\begingroup$ Your last paragraph should be a separate question. $\endgroup$ Commented Sep 28, 2017 at 2:17
  • $\begingroup$ For your second question – which, yes, should have been posted separately – perhaps Which external services are compatible with GeoServer? can help. $\endgroup$
    – C. E.
    Commented Mar 16, 2019 at 22:43

2 Answers 2

7
$\begingroup$
coords = First@Interpreter["StreetAddress"]["14 James Way, Cambridge MA"]; 

For the first part of the question, you can extract and post-process the callout graphics primitives from ListPlot[Callout[..]] and use them with GeoGraphics:

GeoGraphics[{Polygon[Entity["City", {"Cambridge", "Massachusetts", "UnitedStates"}]], 
  GeoMarker[coords, Style["\[FilledCircle]", 14, Blue]],
  Cases[ListPlot[{Callout[coords, "Hi", "CalloutStyle" -> Red]}], _GraphicsGroup, All] /. 
     Offset[a_, b_] :> Offset[a, GeoPosition[b]]}]
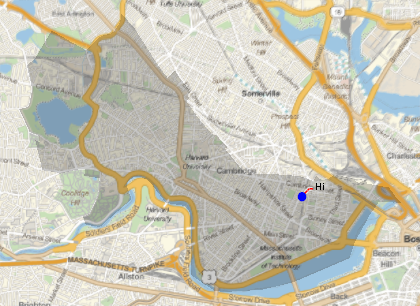
enter image description here

Alternatively, you can use the CalloutMarker as the GeoMarker:

GeoGraphics[{Polygon[Entity["City", {"Cambridge", "Massachusetts", "UnitedStates"}]], 
  Cases[ListPlot[{Callout[coords, "Hi", "CalloutStyle" -> Red, 
       CalloutMarker -> "Star"]}], _GraphicsGroup, All] /.
   {Offset[a_, b_] :> Offset[a, GeoPosition[b]], 
    Inset[a_, b_, c__] :> Inset[a, GeoGridPosition[GeoPosition[b], "Mercator"], c]}}]
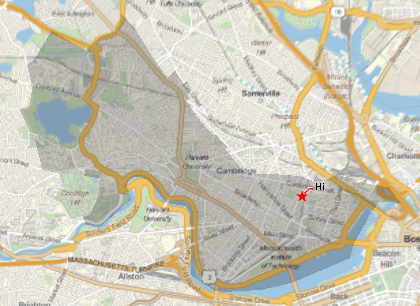
enter image description here

With the options GeoProjection -> {"Bonne", "Centering" -> {0, 0}} and GeoRange -> "World" we get
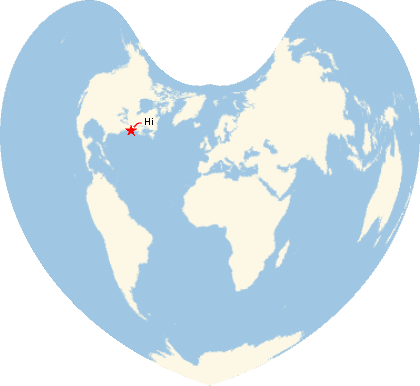
enter image description here

$\endgroup$
3
  • 2
    $\begingroup$ A very nice solution. I hope they will support Callouts and other graphics primitives in future versions, but in the meantime this is a really nice way to do it. $\endgroup$
    – Carl Lange
    Commented Mar 16, 2019 at 23:12
  • 1
    $\begingroup$ Thank you @CarlLange. I agree it would be nice to have Callout working with additional functions. $\endgroup$
    – kglr
    Commented Mar 16, 2019 at 23:23
  • $\begingroup$ @CarlLange This solution seems to have stopped working in v12 $\endgroup$
    – M.R.
    Commented Sep 8, 2019 at 4:50
3
$\begingroup$

Instead of importing the callout primitives from ListPlot into GeoGraphics, you can use Show to combine the GeoGraphics object with the ListPlot output as in this answer to Implementing GeoCallout?. Here's the GeoGraphics object:

bg = GeoGraphics[{Polygon[Entity["City",{"Cambridge","Massachusetts","UnitedStates"}]]}];

To use ListPlot, the geographic coordinates need to be converted to grid coordinates, which depend on the projection used:

coords = First @ Interpreter["StreetAddress"]["14 James Way, Cambridge MA"]
grid = First @ GeoGridPosition[GeoPosition[coords], Lookup[Options[bg], GeoProjection]]

{42.3702, -71.089}

{-71.089, 46.8615}

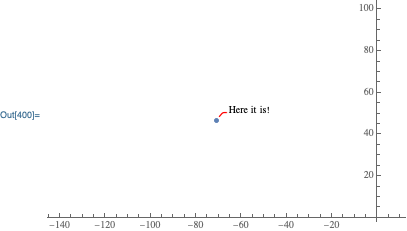
Now, use ListPlot to generate the callout:

listplot = ListPlot[{Callout[grid, "Here it is!", CalloutStyle->Red]}]

enter image description here

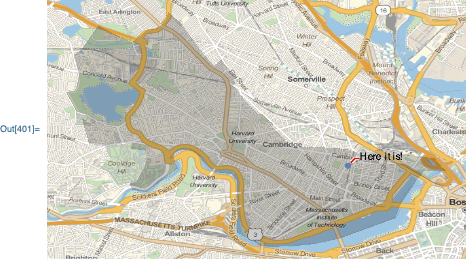
Finally, combine them, making sure to keep the GeoGraphics options:

Show[
    bg,
    listplot,
    Options[bg]
]

enter image description here

$\endgroup$
1
  • 1
    $\begingroup$ @CarlWikk This solution seems to have stopped working in v12 $\endgroup$
    – M.R.
    Commented Sep 8, 2019 at 4:51

Your Answer

By clicking “Post Your Answer”, you agree to our terms of service and acknowledge you have read our privacy policy.

Not the answer you're looking for? Browse other questions tagged or ask your own question.