6
$\begingroup$

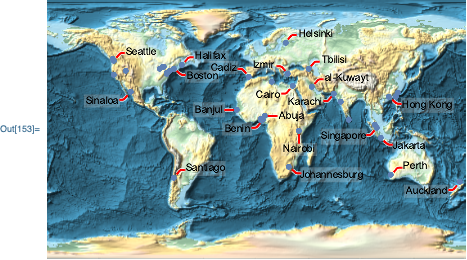
Building off of a related question, I'm looking for a robust way of using Callouts for multiple locations in Geography. For example, I want to plot cities and their names with arrows and text:

data = CloudGet @ CloudObject[
   "https://www.wolframcloud.com/objects/cb8f1216-74dd-463e-85a4-e976b6fd3fd4"];    
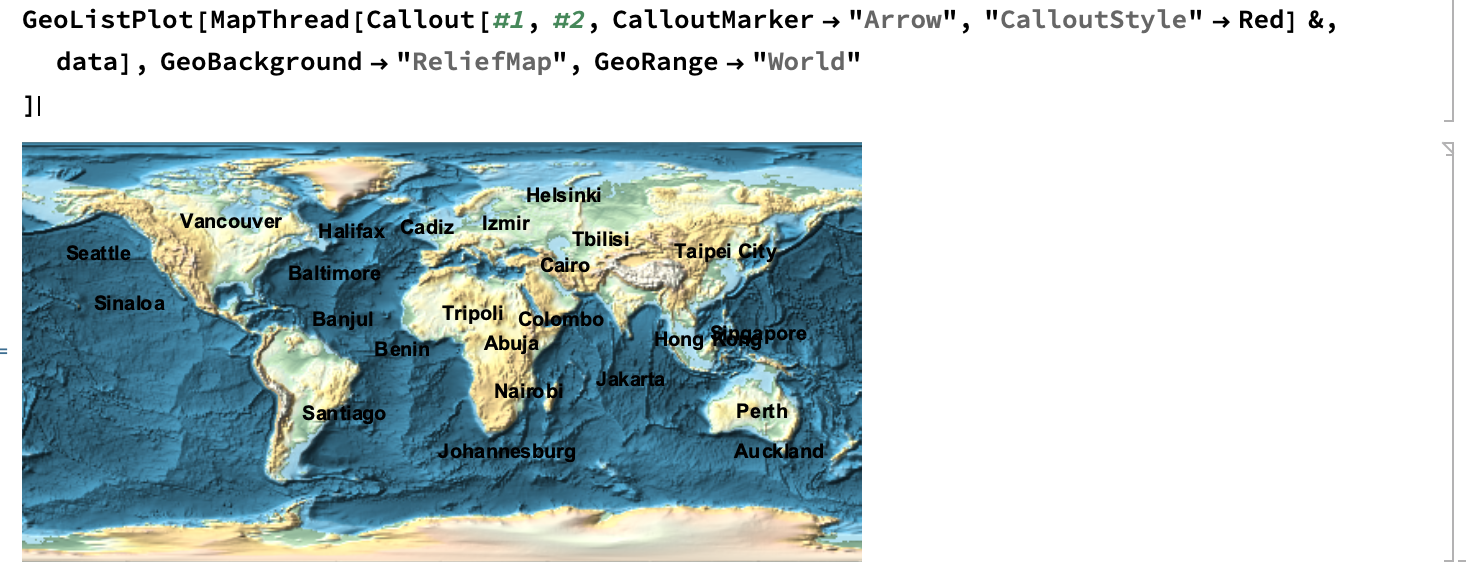
GeoListPlot[MapThread[
  Callout[#1, #2, CalloutMarker -> "Arrow", "CalloutStyle" -> Red] &, 
  data], GeoBackground -> "ReliefMap", GeoRange -> "World"
 ]

enter image description here

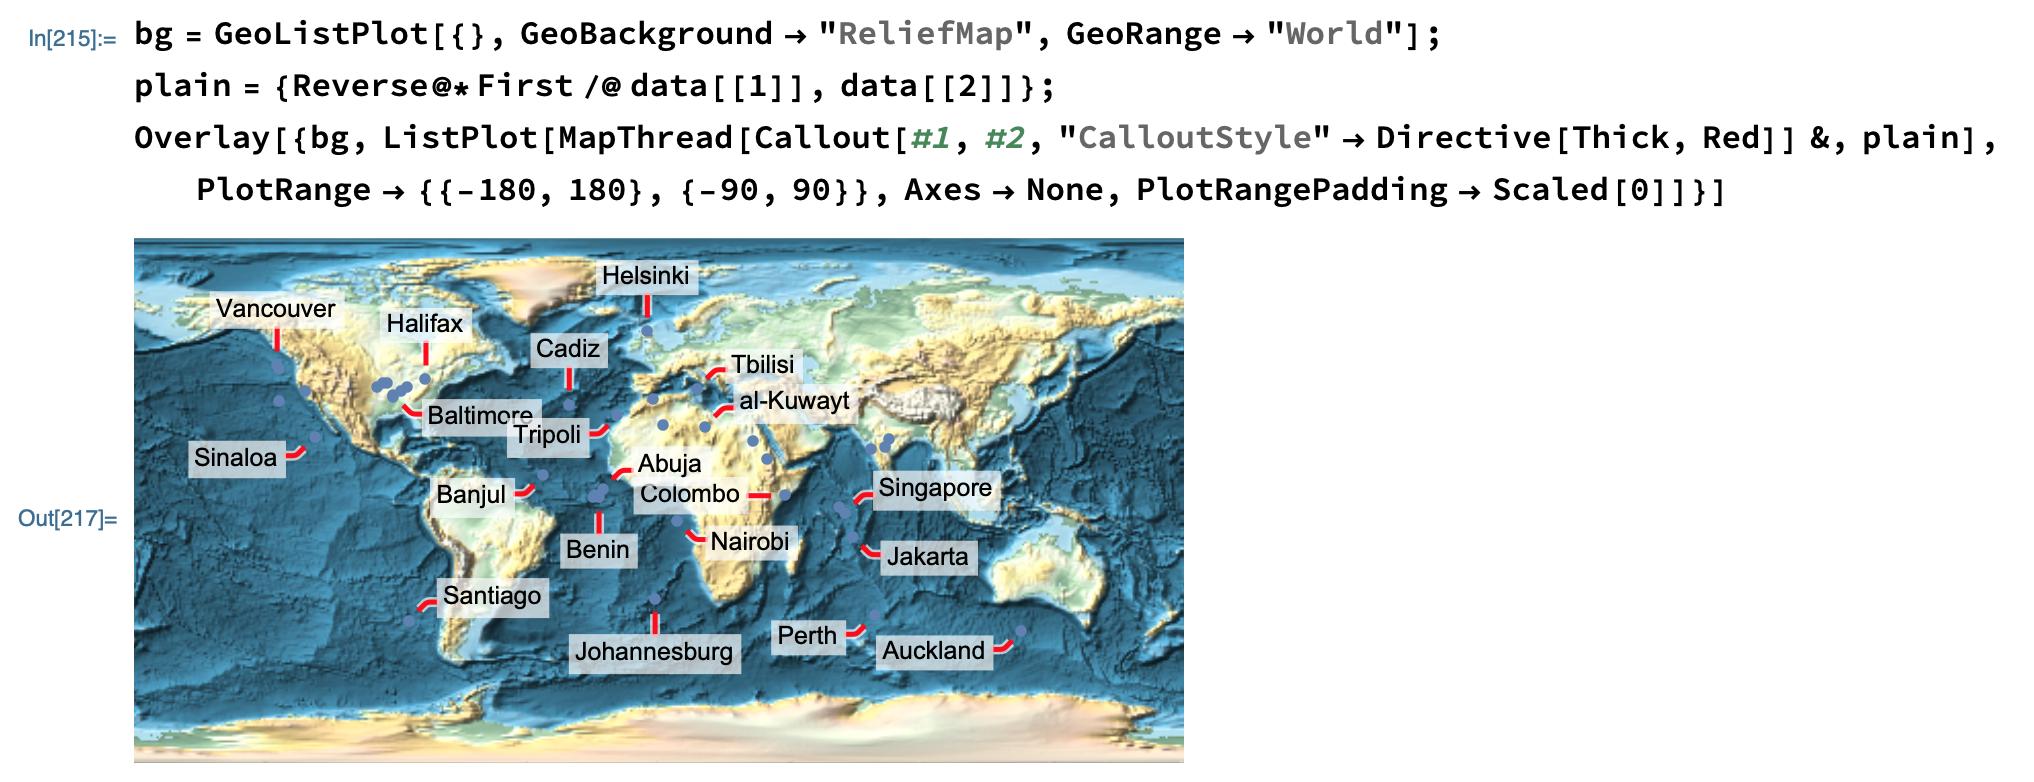
Clearly, Callout's are not supported in GeoGraphics (and don't issue any warnings if you didn't know that). However, my approach is to fake it by using Callout's in a ListPlot and overlay on top of a blank GeoGraphics map background:

bg = GeoListPlot[{}, GeoBackground -> "ReliefMap", 
   GeoRange -> "World"];
plain = {Reverse@*First /@ data[[1]], data[[2]]};
Overlay[{bg, 
  ListPlot[MapThread[
    Callout[#1, #2, "CalloutStyle" -> Directive[Thick, Red]] &, 
    plain], PlotRange -> {{-180, 180}, {-90, 90}}, Axes -> None, 
   PlotRangePadding -> Scaled[0]]}]

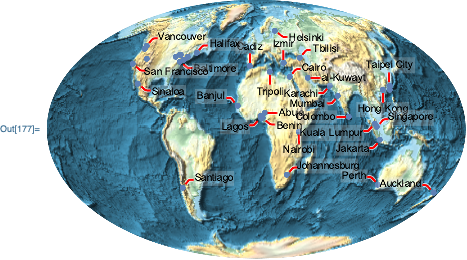
enter image description here

I can't get things to line up exactly for various GeoProjection's, and so that's what I'm looking for help with.

Update for Comment

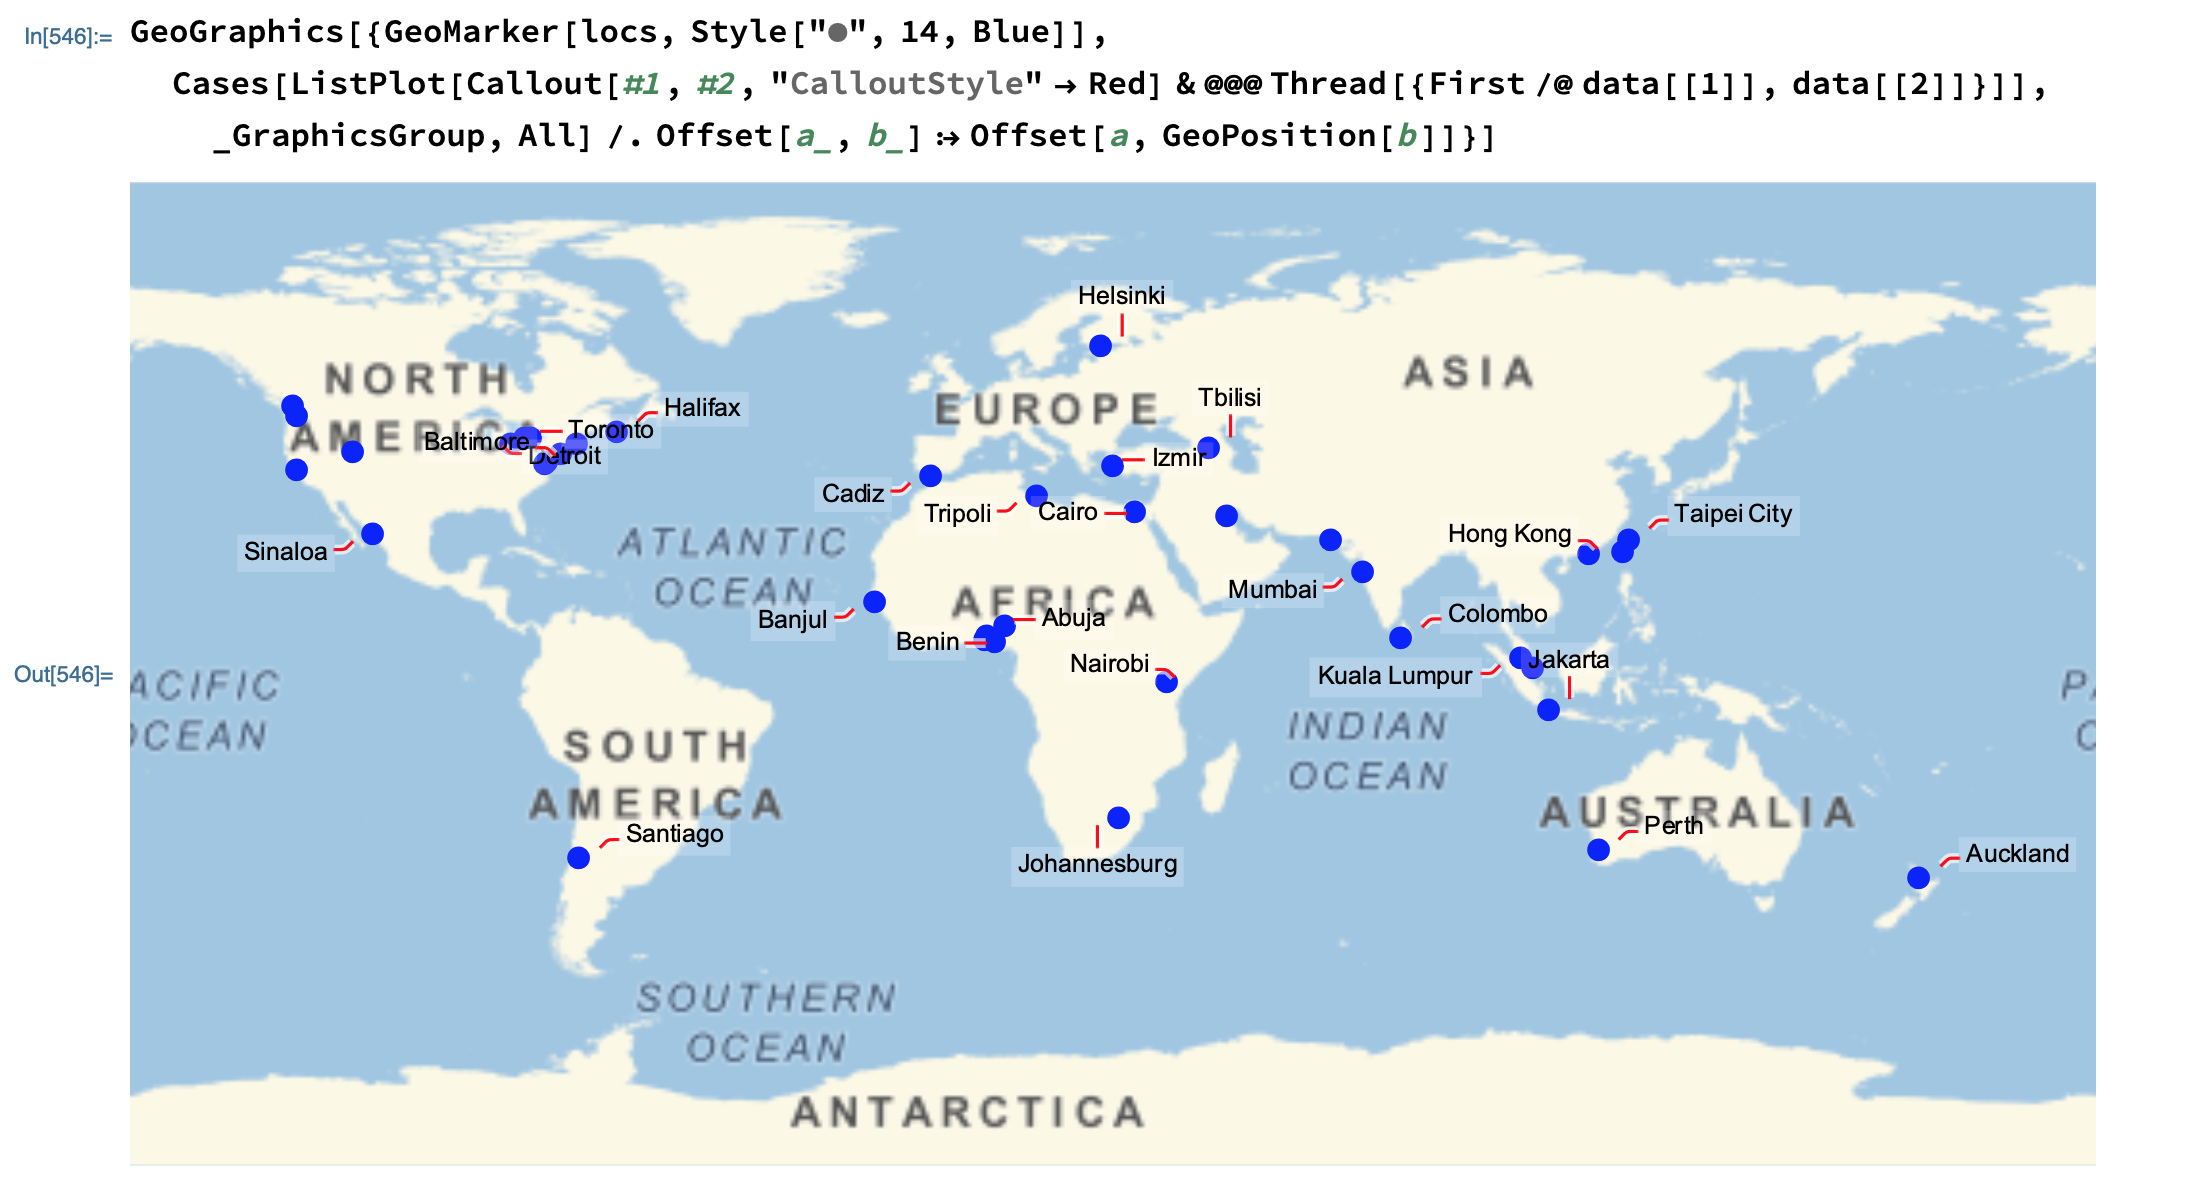
It is different from this related question, because that solution doesn't look good for some reason here:

enter image description here

Final Update

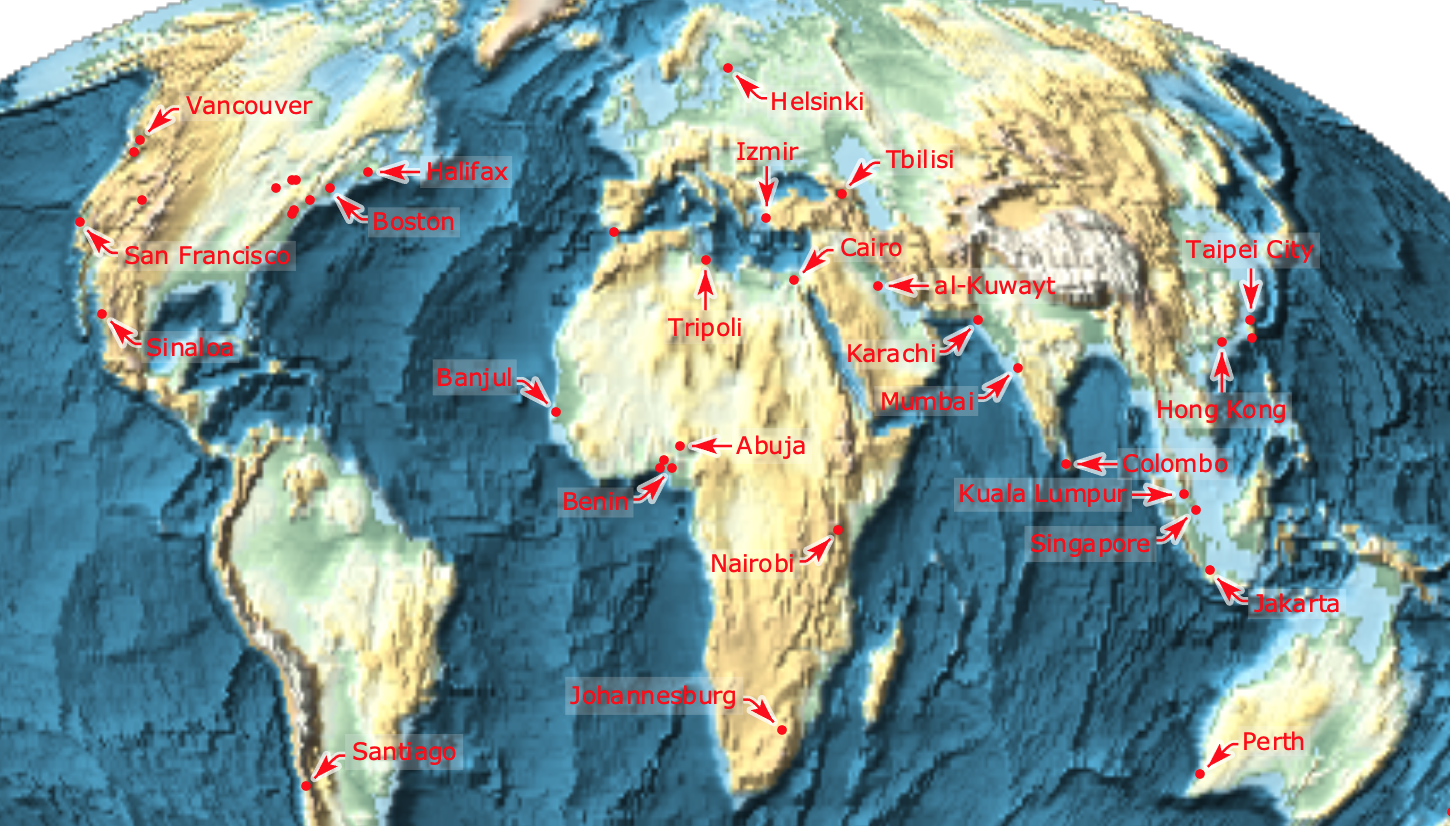
Thanks @carlwoll, that solves it. However, my formatting of the Mollweide project isn't working as expected. Specifically, I'd like higher resolution (and less label collision if possible). But setting GeoZoomLevel -> 4 gets wiped out in the Show. I'd also like the callouts to look like this last example from ref/CalloutMarker:

ListLinePlot[{Callout[Fibonacci[Range[6]], "Fibonacci", {4, 10}, 5, 
   CalloutMarker -> Arrowheads[0.04], CalloutStyle -> Red], 
  Table[LucasL[n], {n, 6}]}]

enter image description here

Here's your code with my formatting tweaks:

bg = GeoListPlot[{}, GeoBackground -> "ReliefMap", 
   GeoRange -> "World", GeoProjection -> "Mollweide", 
   GeoZoomLevel -> 4];
plain = {First@
    GeoGridPosition[GeoPosition[data[[1, All, 1]]], "Mollweide"], 
   data[[2]]};
Show[bg, ListPlot[
  MapThread[
   Callout[#1, #2, Appearance -> "CurvedLeader", LeaderSize -> 20, 
     CalloutMarker -> "Arrow", 
     LabelStyle -> 
      Directive[FontFamily -> "Verdana", FontSize -> 12, 
       FontColor -> Red], CalloutStyle -> Red] &, plain], 
  Axes -> None, PlotRangePadding -> Scaled[0], 
  PlotStyle -> Directive[PointSize[0.005], Red]], 
 Options[bg, PlotRange], ImageSize -> 500]

enter image description here

$\endgroup$
3
  • 1
    $\begingroup$ Can you elaborate on what it is in kglr's solution to related question that isn't good enough? $\endgroup$
    – C. E.
    Commented Mar 25, 2019 at 7:55
  • $\begingroup$ @C.E. Good question, it might just work ok $\endgroup$
    – M.R.
    Commented Mar 25, 2019 at 15:38
  • $\begingroup$ @C.E. see my update, kglr's solution looks nice for 1 place, but for some reason the callouts look wrong for multiple cities. $\endgroup$
    – M.R.
    Commented Mar 25, 2019 at 16:19

2 Answers 2

5
$\begingroup$

Just use Show instead of Overlay:

Show[
    bg,
    ListPlot[
        MapThread[
            Callout[#1,#2,"CalloutStyle"->Directive[Thick,Red]]&,
            plain
        ],
        PlotRange->{{-180,180},{-90,90}},
        Axes->None,
        PlotRangePadding->Scaled[0]
    ]
]

enter image description here

An example using a different projection, where the conversion to grid coordinates is more complicated than just using Reverse:

bg = GeoListPlot[
    {},
    GeoBackground->"ReliefMap",
    GeoRange->"World",
    GeoProjection->"Mollweide"
];
plain = {
    First @ GeoGridPosition[GeoPosition[data[[1, All, 1]]], "Mollweide"],
    data[[2]]
};
Show[
    bg,
    ListPlot[
        MapThread[Callout[#1, #2, "CalloutStyle"->Directive[Thick,Red]]&, plain],
        Axes->None, PlotRangePadding->Scaled[0]
    ],
    Options[bg, PlotRange]
]

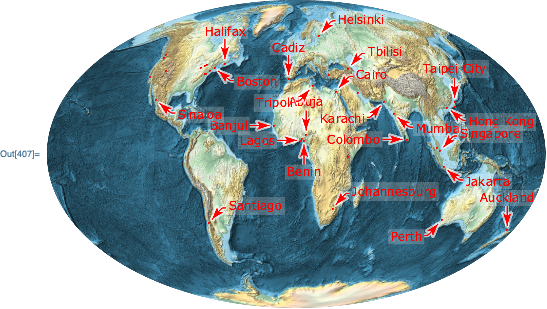
enter image description here

For your updated question

Sometimes some of the other GeoGraphics options need to be included in the Show call, so simplest would be to include them all. This will fix your GeoZoomLevel issue. As for improving label collisions, the size of the ListPlot will control how many callouts are generated. So, adjust the size with the ImageSize option. Examples:

bg = GeoListPlot[{}, GeoBackground -> "ReliefMap", 
    GeoRange -> "World", GeoProjection -> "Mollweide", 
    GeoZoomLevel -> 4
];
plain = {
    First@GeoGridPosition[GeoPosition[data[[1, All, 1]]], "Mollweide"], 
    data[[2]]
};

Your example, including all GeoGraphics options:

Show[
    bg,
    ListPlot[
        MapThread[
            Callout[#1, #2, Appearance -> "CurvedLeader", 
                LeaderSize -> 20, CalloutMarker -> "Arrow",
                LabelStyle -> Directive[FontFamily -> "Verdana", FontSize -> 12, FontColor -> Red],
                CalloutStyle -> Red
            ]&,
            plain
        ], 
        Axes -> None, PlotStyle -> Directive[PointSize[0.005], Red]
    ], 
    Options[bg],
    ImageSize -> 500
]

enter image description here

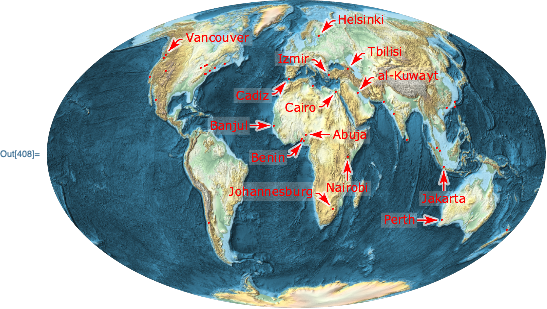
Shrink the ListPlot image size to reduce the number of callouts:

Show[
    bg,
    ListPlot[
        MapThread[
            Callout[#1, #2, Appearance -> "CurvedLeader", 
                LeaderSize -> 20, CalloutMarker -> "Arrow",
                LabelStyle -> Directive[FontFamily -> "Verdana", FontSize -> 12, FontColor -> Red],
                CalloutStyle -> Red
            ]&,
            plain
        ], 
        Axes -> None, PlotStyle -> Directive[PointSize[0.005], Red],
        ImageSize -> 250
    ], 
    Options[bg],
    ImageSize -> 500
]

enter image description here

$\endgroup$
7
  • $\begingroup$ Thanks, this works like a charm, but can you add an example for a 3D globe (sphere) plot too? $\endgroup$
    – M.R.
    Commented Mar 26, 2019 at 19:03
  • $\begingroup$ @M.R. I don't think callouts are supported in 3d graphics. $\endgroup$
    – Carl Woll
    Commented Mar 26, 2019 at 19:18
  • $\begingroup$ ListPointPlot3D[RandomReal[1, {6, 3}] -> RandomWord[6], LabelingFunction -> Callout] and FeatureSpacePlot3D has LabelingFunction -> Callout, so it's probably doable no? $\endgroup$
    – M.R.
    Commented Mar 26, 2019 at 19:27
  • $\begingroup$ @M.R. Good point. Sounds doable, then, although the labels at the edges will probably be partially hidden by the globe. $\endgroup$
    – Carl Woll
    Commented Mar 26, 2019 at 19:58
  • $\begingroup$ Actually nevermind you are correct, 3D callouts are too hard! But if you could show how to increase the resolution in the Show, that would be great - right now looks too blurry :/ $\endgroup$
    – M.R.
    Commented Mar 26, 2019 at 19:59
3
$\begingroup$

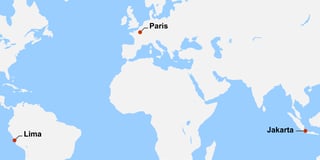
How about something like this?

{Callout[GeoPosition[{48.86`, 2.34`}], "Paris"], 
  Callout[GeoPosition[{-6.18`, 106.83`}], "Jakarta", {Left}], 
  Callout[GeoPosition[{-12.043333`, -77.028333`}], "Lima"]};

pointsLabeled = 
 GeoListPlot[%, GeoRange -> Automatic, 
  GeoBackground -> "VectorBusiness"]

A map with labeled callouts

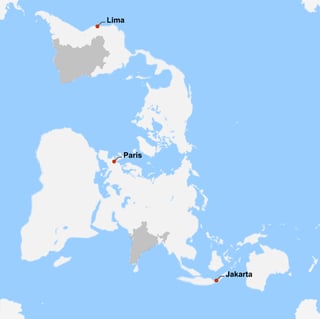
If you need to add other features that are not easy to plot using GeoListPlot, you can use Show[] to compose multiple layers. This would look something like this:

(*Define a list of callouts:*){Callout[GeoPosition[{48.86`, 2.34`}], 
   "Paris"], Callout[GeoPosition[{-6.18`, 106.83`}], "Jakarta"], 
  Callout[GeoPosition[{-12.043333`, -77.028333`}], "Lima"]};

(*Then,make a labeled points layer and a background layer,which can
contain additional geometry:*)
pointsLabeled = GeoListPlot[%, GeoBackground -> Transparent];
bg = GeoGraphics[{Entity["Country", "India"]["Polygon"], 
    Entity["Country", "Brazil"]["Polygon"]},
   GeoBackground -> "VectorBusiness"];

(*Finally,use `Show[]` to compose the plots:*)
Show[bg, pointsLabeled, GeoProjection -> "PeirceQuincuncial", 
 GeoRange -> "World"]

A map with labelled callouts and additional geometry

Note that the bg geometry I am plotting here can also be plotted directly from within the pointsLabeled GeoListPlot[] command.

I hope this is helpful! This method has worked for me for every projection I have tested.

$\endgroup$

Your Answer

By clicking “Post Your Answer”, you agree to our terms of service and acknowledge you have read our privacy policy.

Not the answer you're looking for? Browse other questions tagged or ask your own question.