For your updated question
Sometimes some of the other GeoGraphics options need to be included in the Show call, so simplest would be to include them all. This will fix your GeoZoomLevel issue. As for improving label collisions, the size of the ListPlot will control how many callouts are generated. So, adjust the size with the ImageSize option. Examples:
bg = GeoListPlot[{}, GeoBackground -> "ReliefMap",
    GeoRange -> "World", GeoProjection -> "Mollweide",
    GeoZoomLevel -> 4
];
plain = {
    First@GeoGridPosition[GeoPosition[data[[1, All, 1]]], "Mollweide"],
    data[[2]]
};
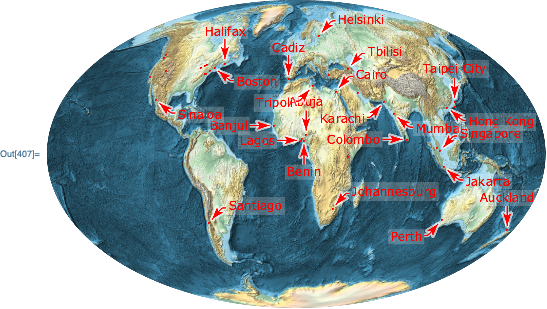
Your example, including all GeoGraphics options:
Show[
    bg,
    ListPlot[
        MapThread[
            Callout[#1, #2, Appearance -> "CurvedLeader",
                LeaderSize -> 20, CalloutMarker -> "Arrow",
                LabelStyle -> Directive[FontFamily -> "Verdana", FontSize -> 12, FontColor -> Red],
                CalloutStyle -> Red
            ]&,
            plain
        ],
        Axes -> None, PlotStyle -> Directive[PointSize[0.005], Red]
    ],
    Options[bg],
    ImageSize -> 500
]
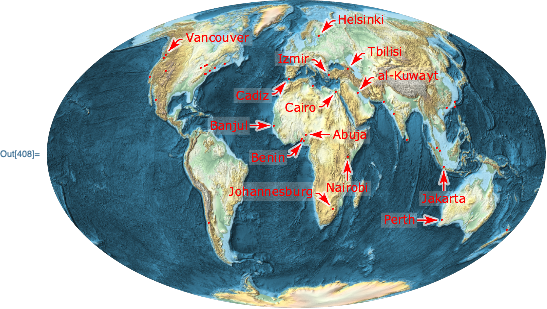
Shrink the ListPlot image size to reduce the number of callouts:
Show[
    bg,
    ListPlot[
        MapThread[
            Callout[#1, #2, Appearance -> "CurvedLeader",
                LeaderSize -> 20, CalloutMarker -> "Arrow",
                LabelStyle -> Directive[FontFamily -> "Verdana", FontSize -> 12, FontColor -> Red],
                CalloutStyle -> Red
            ]&,
            plain
        ],
        Axes -> None, PlotStyle -> Directive[PointSize[0.005], Red],
        ImageSize -> 250
    ],
    Options[bg],
    ImageSize -> 500
]


