14
$\begingroup$

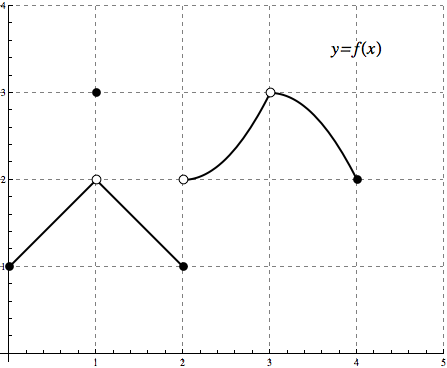
I'm trying to replicate a graph from my math book for my notes as well as to learn Mathematica. I was hoping someone would be able to help me figure out how to add the open points to the graph, and possibly add a slight curve to the lines as shown in the real graph. My lines are straight.

The Graph from the book:

What I've been able to come up with:

   g[x_] := \[Piecewise] {
   {x + 1, x < 1},
   {-x + 3, x < 2},
   {(x + 2) - 2, x < 3},
   {-x + 6, x < 4}
  }

Plot[g[x], {x, 0, 5}, 
 PlotStyle -> {Thick}, PlotRange -> {0, 5},
 Ticks -> {{0, 1, 2, 3, 4, 5}, {0, 1, 2, 3, 4, 5}, Automatic},
 GridLines -> {{0, 1, 2, 3, 4, 5}, {0, 1, 2, 3, 4, 5}},
 GridLinesStyle -> Directive[LightGray, Dashed],
 Epilog -> {Red, Dashed, PointSize[Large],
   Point[{{0, 1}, {1, 3}, {2, 1}, {4, 2}}]
   }
 ]
$\endgroup$
1
  • $\begingroup$ Try Epilog -> {Red, Dashed, PointSize[Large], Point[{{0, 1}, {1, 3}, {2, 1}, {4, 2}}], White, PointSize[Medium], Point[{{0, 1}, {1, 3}, {2, 1}, {4, 2}}]} $\endgroup$ Commented Oct 1, 2012 at 13:02

2 Answers 2

20
$\begingroup$

Looks good. You just need to add quadratics and open points.

r = 0.05;
g[x_] := Piecewise[{
  {x + 1, x < 1},
  {-x + 3, 1 <= x < 2},
  {(x - 2)^2 + 2, 2 <= x < 3},
  {3 - (x - 3)^2, 3 <= x < 4}
}];
Plot[g[x], {x, 0, 4}, AspectRatio -> Automatic,
 PlotStyle -> Directive[Thick, Black],
 PlotRange -> {{-0.1, 5}, {-0.1, 4}},
 Epilog -> {
   {Disk[{0, 1}, r], Disk[{2, 1}, r], Disk[{4, 2}, r], 
    Disk[{1, 3}, r]},
   {White, EdgeForm[Black], Disk[{1, 2}, r], Disk[{2, 2}, r], 
    Disk[{3, 3}, r]},
   Text[Style["y=f(x)", FontSize -> 18, Italic, 
    Background -> White], {4,3.5}]
   }, GridLines -> Automatic, 
 GridLinesStyle -> Directive[Gray, Dashed]]

enter image description here

$\endgroup$
3
  • $\begingroup$ Tiny issue (which I've also run into) is that your horizontal grid lines on the y-axis run into the tick labels. $\endgroup$
    – s0rce
    Commented Oct 1, 2012 at 17:14
  • $\begingroup$ @s0rce Well, that's really a completely different issue. Perhaps, you should post a question to the main site. $\endgroup$ Commented Oct 1, 2012 at 19:40
  • $\begingroup$ I was just about to and I realized someone beat me to it: mathematica.stackexchange.com/questions/3618/… $\endgroup$
    – s0rce
    Commented Oct 2, 2012 at 20:24
6
$\begingroup$

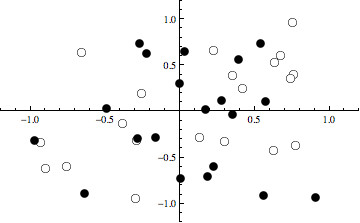
If you want to use specific markers in your plots, you can specify your markers to use them with PlotMarkers:

emptyCircle[size_, thickness_] := 
     Graphics[{{EdgeForm[Thickness[thickness]], Black, Circle[]}, {White,
     Disk[]}}, ImageSize -> size];
filledCircle[size_] := Graphics[{Black, Disk[]}, ImageSize -> size];

ListPlot[{RandomReal[{-1, 1}, {20, 2}], RandomReal[{-1, 1}, {20, 2}]},
    PlotMarkers -> {emptyCircle[10, .01], filledCircle[10]}, 
    PlotRange -> {{-1.2, 1.2}, {-1.2, 1.2}}]

enter image description here

$\endgroup$

Your Answer

By clicking “Post Your Answer”, you agree to our terms of service and acknowledge you have read our privacy policy.