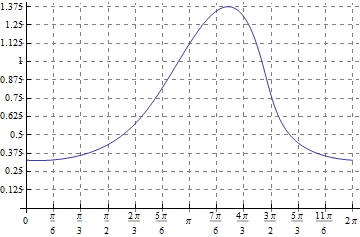
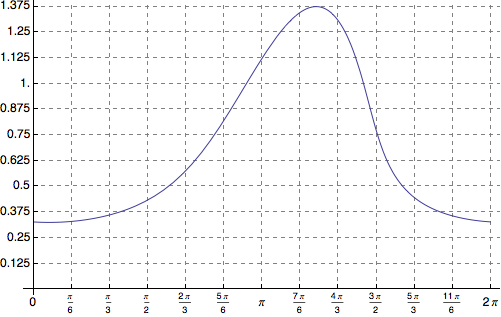
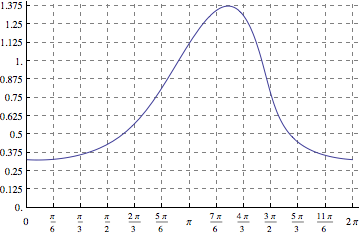
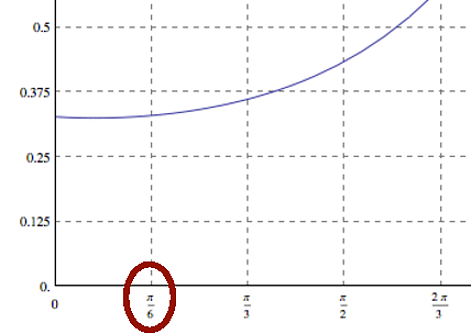
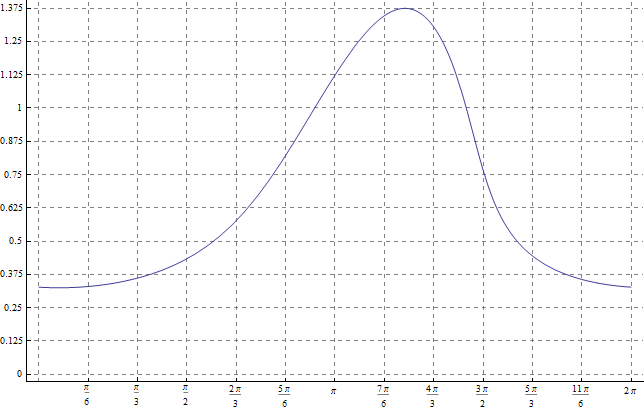
I wish to include the plot generated by the following Mathematica code
Plot[1/Root[-3 - 8 #1 Tan[a/2] - 3 Tan[a/2]^2
               + #1^4 (1 + Tan[a/2]^2) + #1^2 (-9 + 3 Tan[a/2]^2) &, 2],
  {a, 0, 2 Pi},
  AxesOrigin -> {0, 0},
  Ticks -> {{0, Pi/6, Pi/3, Pi/2, 2 Pi/3, 5 Pi/6, Pi, 7 Pi/6, 4 Pi/3,
    3 Pi/2, 5 Pi/3, 11 Pi/6, 2 Pi}, {0, 0.125, 0.25, 0.375, 0.5,
    0.625, 0.75, 0.875, 1, 1.125, 1.25, 1.375, 1.5}},
  GridLines -> {{Pi/6, Pi/3, Pi/2, 2 Pi/3, 5 Pi/6, Pi, 7 Pi/6, 4 Pi/3,
    3 Pi/2, 5 Pi/3, 11 Pi/6, 2 Pi}, {0, 1/8, 2/8, 3/8, 4/8, 5/8, 6/8,
    7/8, 1, 9/8, 10/8, 11/8, 12/8}},
  GridLinesStyle -> Directive[Dashed]]
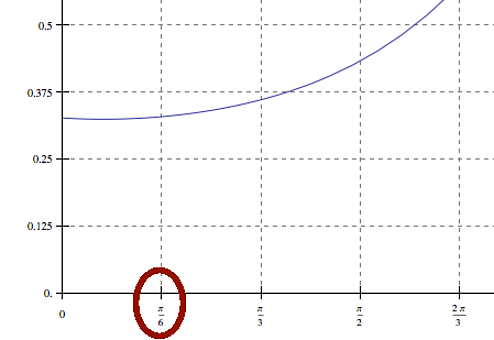
in an article I'm writing. I don't like how the GridLines overlap the axis labels however. I searched around a bit for a solution but I'm no Mathematica expert and I can't work it out. Does anyone have a solution?

Ticks -> {Range[0,2Pi,Pi/6],Range[0,1.5,0.125]}and the same idea for your GridLines - does the same but is clearer. $\endgroup$