4
$\begingroup$

According to the documentation of Ticks, a ticks function

The tick mark function func[Subscript[x, min],Subscript[x, max]] may return any other tick mark option

For example,

tickFunc = Subdivide[#1, #2, 6] &;
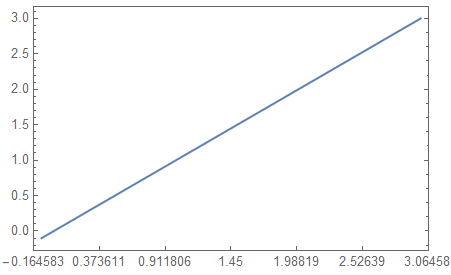
Plot[x, {x, -0.1, 3}, Frame -> True, 
 FrameTicks -> {{Automatic, Automatic}, {tickFunc, Automatic}}]

Will show

enter image description here

But I want to know what is the default tick mark function when setting Ticks to Automatics?

A simple manipulate like

Manipulate[Plot[x, {x, -0.1, n}, Frame -> True], {n, 1, 200, 1}]

does show some definite feature of ticks, for example, number of ticks is always between 4 and 8. But I failed to construct a tick mark function behave as default. Does anyone have ideas?

$\endgroup$
5
  • $\begingroup$ You might be interested in FindDivisions[]: FindDivisions[{-0.1, 3}, {7, 6}] $\endgroup$ Commented Mar 14, 2018 at 14:00
  • $\begingroup$ Hi, @J.M. I don't quite get it. What do you mean? $\endgroup$
    – matheorem
    Commented Mar 14, 2018 at 14:06
  • $\begingroup$ Look carefully at the ticks in Plot[x, {x, -0.1, 3}, Frame -> True], and then look at the result of N[FindDivisions[{-0.1, 3}, {7, 6}]]. Notice anything? $\endgroup$ Commented Mar 14, 2018 at 14:18
  • $\begingroup$ @J.M. yeah, the division is the same except -0.5. But I still don't understand how to make the default tick mark function. Because, the tick number is changing, not fixed. $\endgroup$
    – matheorem
    Commented Mar 14, 2018 at 14:35
  • $\begingroup$ @J.M. Oh, I seems understand what you mean now. Thank you so much! : ) $\endgroup$
    – matheorem
    Commented Mar 14, 2018 at 15:01

1 Answer 1

5
$\begingroup$

You can get a fairly close approximation using the internal functions Charting`ScaledTicks and Charting`ScaledFrameTicks:

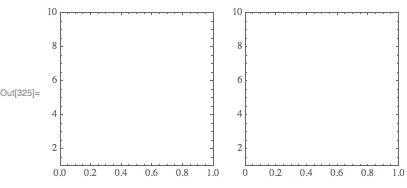
GraphicsRow[{
    Graphics[
        {}, PlotRange->{{0,1},{1,10}},Frame->True,AspectRatio->1
    ],
    Graphics[
        {}, PlotRange->{{0,1},{1,10}},Frame->True,AspectRatio->1,
        FrameTicks->{
            {
                Charting`ScaledTicks[{Identity,Identity}],
                Charting`ScaledFrameTicks[{Identity,Identity}]
            },
            {
                Charting`ScaledTicks[{Identity,Identity}],
                Charting`ScaledFrameTicks[{Identity,Identity}]
            }
        }
    ]
}]

enter image description here

You'll notice that the origins are different.

If you look at the output of plotting functions, you will sometimes see these internal functions:

Options[LogPlot[x, {x, 1, 10}], Ticks]

{Ticks -> {Automatic, Charting`ScaledTicks[{Log, Exp}]}}

$\endgroup$
1
  • $\begingroup$ Great, Thank you so much. I actually looked into FullForm of Graphics and found this Charting'ScaledTicks, But I didn't realize that it is already a tick mark function. But I found it is not the origin that can be different. For example, compare Charting`ScaledTicks[{Identity, Identity}][-0.1, 3] and Plot[x, {x, -0.1, 3}, Frame -> True, FrameTicks -> {{Charting`ScaledTicks[{Identity, Identity}], Charting`ScaledFrameTicks[{Identity, Identity}]}, {Charting`ScaledTicks[{Identity, Identity}], Charting`ScaledFrameTicks[{Identity, Identity}]}}] $\endgroup$
    – matheorem
    Commented Mar 14, 2018 at 14:58

Your Answer

By clicking “Post Your Answer”, you agree to our terms of service and acknowledge you have read our privacy policy.

Not the answer you're looking for? Browse other questions tagged or ask your own question.