13
$\begingroup$

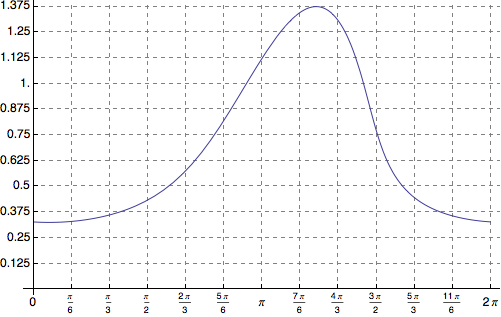
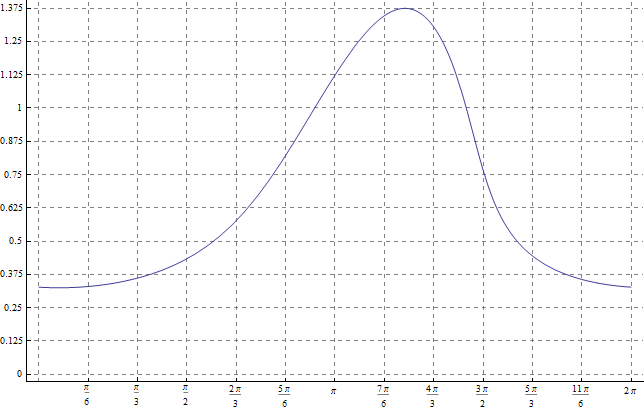
I wish to include the plot generated by the following Mathematica code

Plot[1/Root[-3 - 8 #1 Tan[a/2] - 3 Tan[a/2]^2
               + #1^4 (1 + Tan[a/2]^2) + #1^2 (-9 + 3 Tan[a/2]^2) &, 2],
  {a, 0, 2 Pi},
  AxesOrigin -> {0, 0}, 
  Ticks -> {{0, Pi/6, Pi/3, Pi/2, 2 Pi/3, 5 Pi/6, Pi, 7 Pi/6, 4 Pi/3, 
    3 Pi/2, 5 Pi/3, 11 Pi/6, 2 Pi}, {0, 0.125, 0.25, 0.375, 0.5, 
    0.625, 0.75, 0.875, 1, 1.125, 1.25, 1.375, 1.5}}, 
  GridLines -> {{Pi/6, Pi/3, Pi/2, 2 Pi/3, 5 Pi/6, Pi, 7 Pi/6, 4 Pi/3, 
    3 Pi/2, 5 Pi/3, 11 Pi/6, 2 Pi}, {0, 1/8, 2/8, 3/8, 4/8, 5/8, 6/8, 
    7/8, 1, 9/8, 10/8, 11/8, 12/8}}, 
  GridLinesStyle -> Directive[Dashed]]

Mathematica graphics

in an article I'm writing. I don't like how the GridLines overlap the axis labels however. I searched around a bit for a solution but I'm no Mathematica expert and I can't work it out. Does anyone have a solution?

$\endgroup$
3
  • 2
    $\begingroup$ One small remark, you could use Ticks -> {Range[0,2Pi,Pi/6],Range[0,1.5,0.125]} and the same idea for your GridLines - does the same but is clearer. $\endgroup$
    – Ronny
    Commented Mar 28, 2012 at 11:43
  • $\begingroup$ @Ronny thanks, as I said I'm not really very good at Mathematica. I tend (in things related to Mathematica) to learn the bare minimum required to get what I want :). $\endgroup$ Commented Mar 28, 2012 at 12:23
  • 1
    $\begingroup$ Just added the plot graphics so people can see what ails you. $\endgroup$
    – Yves Klett
    Commented Mar 28, 2012 at 13:24

4 Answers 4

10
$\begingroup$

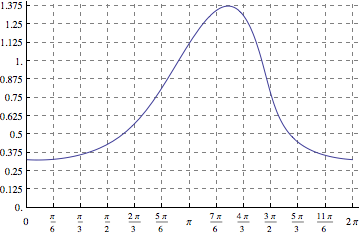
Setting PlotRangePadding to zero is probably the easiest option, but as an alternative you could draw the grid lines by hand using ProLog:

ticks = {Range[0, 2 Pi, Pi/6], Range[0, 1.5, .125]};
Plot[1/Root[-3 - 8 #1 Tan[a/2] - 
     3 Tan[a/2]^2 + #1^4 (1 + Tan[a/2]^2) + #1^2 (-9 + 
        3 Tan[a/2]^2) &, 2], {a, 0, 2 Pi}, AxesOrigin -> {0, 0},
 Ticks -> ticks,
 Prolog -> 
  Style[{Gray, Dashed, 
    Line[{{#, 0}, {#, 1.4}}] & /@ Rest[ticks[[1]]], 
    Line[{{0, #}, {2 Pi + .2, #}}] & /@ Rest[ticks[[2]]]}, 
   Antialiasing -> False]]

Mathematica graphics

$\endgroup$
1
  • $\begingroup$ This is my favourite, since Prolog is something I should have thought of to use. I wasn't certain of the syntax but I did at least know it existed! About the axes: I really don't like the decimal point after the 1, so will write that out as before. I had no idea it would work for the radians though. Cheers! $\endgroup$ Commented Mar 28, 2012 at 12:30
12
$\begingroup$

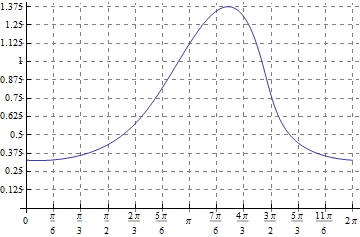
An alternative to kguler's approach is to set PlotRangePadding to zero on the relevant sides.

Notice I've simplified your grid and tick specifications using Range. The y-axis ticks need to be machine-precision (1/8. increment) or they will actually be fractions. If you don't like the decimal point after the 0 and 1, then the full listing as in your question is needed for the ticks (but not the gridlines).

Plot[1/Root[-3 - 8 #1 Tan[a/2] - 
     3 Tan[a/2]^2 + #1^4 (1 + Tan[a/2]^2) + #1^2 (-9 + 
        3 Tan[a/2]^2) &, 2], {a, 0, 2 Pi}, AxesOrigin -> {0, 0}, 
 Ticks -> {Range[0, 2 Pi, Pi/6], Range[0, 12/8, 1/8.]}, 
 GridLines -> {Range[0, 2 Pi, Pi/6], Range[0, 12/8, 1/8]}, 
 GridLinesStyle -> Directive[Dashed], 
 PlotRangePadding -> {{0, Scaled[0.02]}, {0, Scaled[0.02]}}]

enter image description here

$\endgroup$
2
  • $\begingroup$ Thanks for the answer, now I've learnt PlotRangePadding... had no idea what it did before (surely not designed to solve this problem). $\endgroup$ Commented Mar 28, 2012 at 12:29
  • $\begingroup$ Stick around, there are plenty of little-known corners of Mathematica's graphics functionality that get explored on this site! And a few German-speaking Aussies. $\endgroup$
    – Verbeia
    Commented Mar 28, 2012 at 12:33
7
$\begingroup$

Adjusting the lengths of ticks

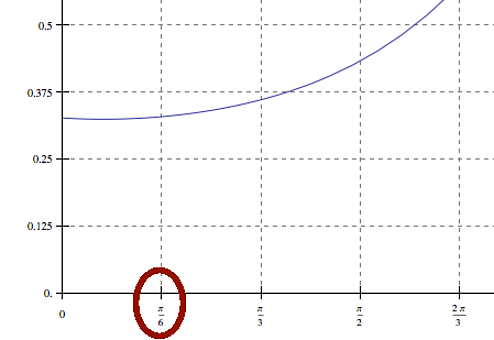
Building on @Verbeia's solution, you may want to shorten the tick mark length by using the third parameter of Ticks. This leaves both a negative and positive tail for each tick (see pic 1, below):

Plot[1/Root[-3 - 8 #1 Tan[a/2] - 3 Tan[a/2]^2 + #1^4 (1 + Tan[a/2]^2) + #1^2 (-9 + 
    3 Tan[a/2]^2) &, 2], {a, 0, 2 Pi}, AxesOrigin -> {0, 0}, 
    Ticks -> {Range[0, 2 Pi, Pi/6] /. {n_?NumericQ -> {n, n, 0.01}}, 
              Range[0, 12/8, 1/8.] /. {n_?NumericQ -> {n, n, 0.01}}}, 
    GridLines -> {Range[0, 2 Pi, Pi/6], Range[0, 12/8, 1/8]}, 
    GridLinesStyle -> Directive[Dashed], 
    PlotRangePadding -> {{0, Scaled[0.02]}, {0, Scaled[0.02]}}]

ticks3

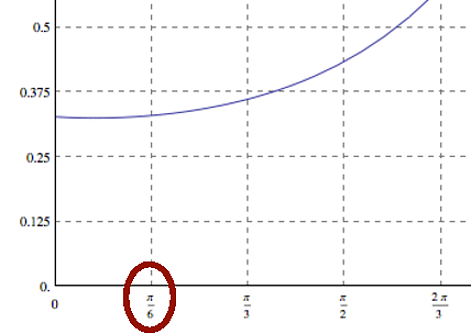
Or you may want to get rid of ticks altogether, using ticks of zero length by using /.{n_?NumericQ -> {n, n, 0}} instead of /.{n_?NumericQ -> {n, n, 0.01}}.

ticks4

$\endgroup$
3
$\begingroup$

Try

 Plot[1/Root[-3 - 8 #1 Tan[a/2] - 3 Tan[a/2]^2 + #1^4 (1 + Tan[a/2]^2) + #1^2 (-9 + 
    3 Tan[a/2]^2) &, 2], {a, 0, 2 Pi}, AxesOrigin -> {0, 0}, 
 Frame -> {True, True, False, False}, 
 FrameTicks -> {{{0, 0.125, 0.25, 0.375, 0.5, 0.625, 0.75, 0.875, 1, 
 1.125, 1.25, 1.375, 1.5}, None}, 
 {{Pi/6, Pi/3, Pi/2, 2 Pi/3, 5 Pi/6, Pi, 7 Pi/6, 4 Pi/3, 
 3 Pi/2, 5 Pi/3, 11 Pi/6, 2 Pi}, None}}, 
 GridLines -> {{0, Pi/6, Pi/3, Pi/2, 2 Pi/3, 5 Pi/6, Pi, 7 Pi/6, 
 4 Pi/3, 3 Pi/2, 5 Pi/3, 11 Pi/6, 2 Pi}, {0, 1/8, 2/8, 3/8, 4/8, 
 5/8, 6/8, 7/8, 1, 9/8, 10/8, 11/8, 12/8}}, 
 GridLinesStyle -> Directive[Dashed]]

to get

enter image description here

$\endgroup$
2
  • $\begingroup$ Thanks, although I really didn't want to move the axes. $\endgroup$ Commented Mar 28, 2012 at 12:28
  • $\begingroup$ @GlenWheeler, you need to add PlotRangePadding->0; or, better yet, just use PlotRangePadding as in Verbeia's answer. $\endgroup$
    – kglr
    Commented Mar 30, 2012 at 9:08

Your Answer

By clicking “Post Your Answer”, you agree to our terms of service and acknowledge you have read our privacy policy.

Not the answer you're looking for? Browse other questions tagged or ask your own question.