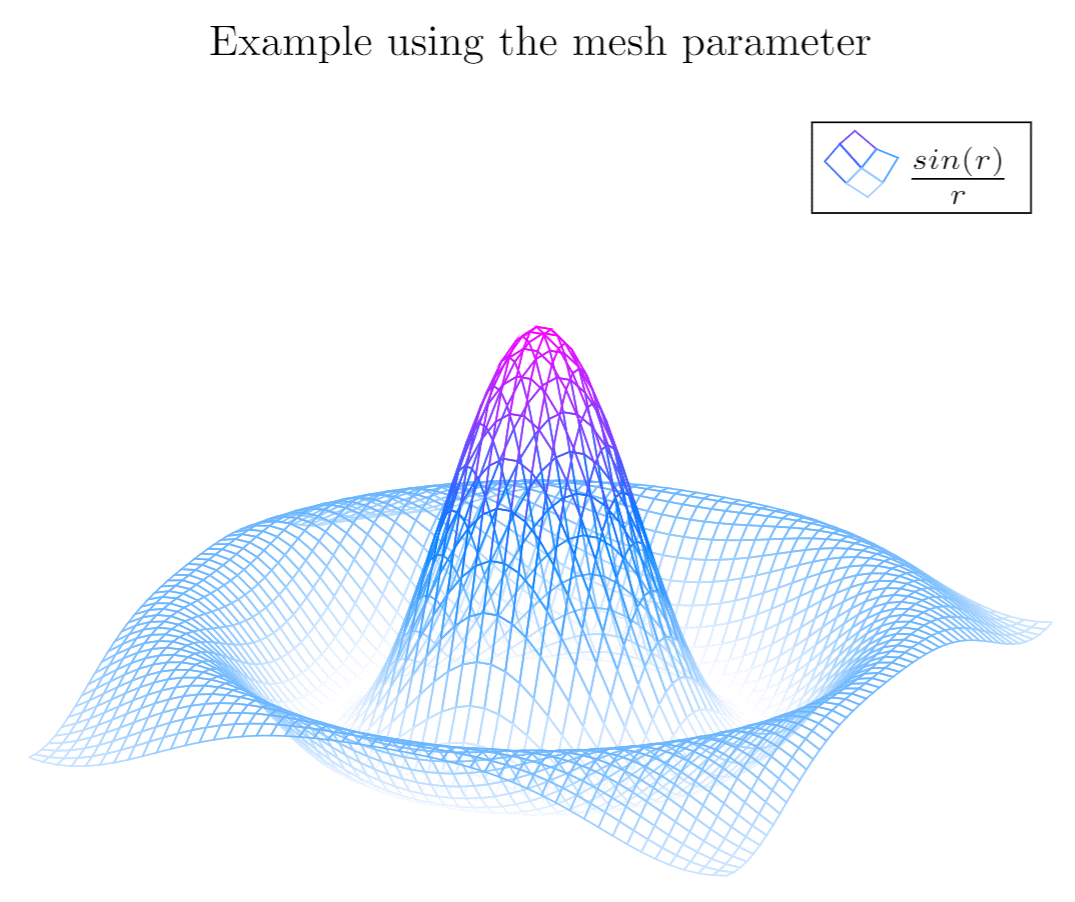
I'm trying to replicate the plot theme of $\LaTeX$'s pgtplots for 3D surfaces in Mathematica's Plot3D Function. The goal is to create something similar to this:
So I played around with the opacity and different color gradients for a bit until i got this:
 Plot3D[Sin[Sqrt[x^2 + y^2]]/Sqrt[x^2 + y^2], {x, -2 Pi, 2 Pi}, {y, -2 Pi, 2 Pi},
 PlotRange -> {-1, 1},
 BoxRatios -> {1, 1, 1},
 Boxed -> False,
 Axes -> False,
 ColorFunction -> (Opacity[#3 + .1, ColorData[{"DeepSeaColors", "Reverse"}][#3]] &),
 Mesh -> None,
 PlotPoints -> 100
 ]
However, I want the ColorFunction directives to be applied to the mesh rather than the surface. My approach was to simply do something like this:
 Plot3D[Sin[Sqrt[x^2 + y^2]]/Sqrt[x^2 + y^2], {x, -2 Pi, 2 Pi}, {y, -2 Pi, 2 Pi},
 PlotRange -> {-1, 1},
 BoxRatios -> {1, 1, 1},
 Boxed -> False,
 Axes -> False,
 PlotStyle -> Opacity[0],
 MeshStyle -> ColorFunction -> (Opacity[#3 + .1, ColorData[{"DeepSeaColors", "Reverse"}][#3]] &),
 PlotPoints -> 100
 ]
But apparently, this idea is completely wrong. It seems to me that MeshStyle will not accept values that depend on the plotted function. Is there any way to make this work within the Plot3D function? Any help would be greatly appreciated.


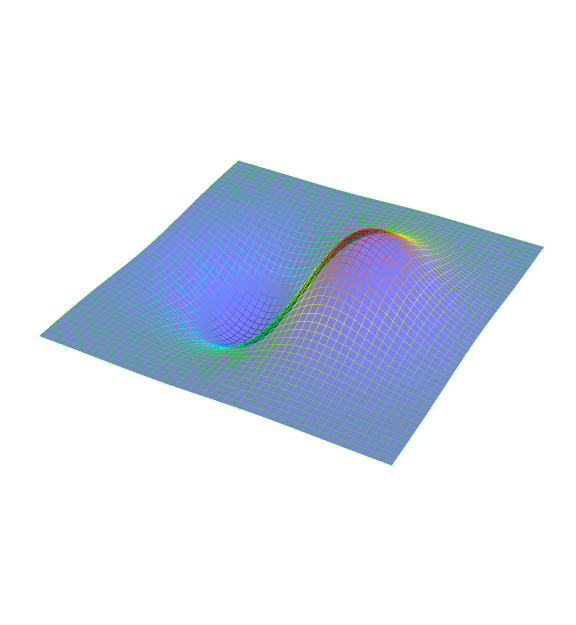
With[{plot=Plot3D[Sin[Sqrt[x^2 + y^2]]/Sqrt[x^2 + y^2], {x, -2 Pi, 2 Pi}, {y, -2 Pi, 2 Pi}, BoxRatios -> {1, 1, 1}, PlotRange -> {-1, 1}, Boxed -> False, Axes -> False, PlotStyle -> None, PlotPoints -> 100]}, With[{cf = ColorData["RedBlueTones"][#3] &}, plot /. GraphicsComplex[pts_, g_, opts___] :> GraphicsComplex[pts, g /. Line[p_] :> Line[p, VertexColors -> MapThread[cf, Part[Rescale /@ Transpose[pts], All, p]]], opts]]]$\endgroup$GraphicsComplexintact is much more responsive. I will borrow from it if you don't mind. $\endgroup$