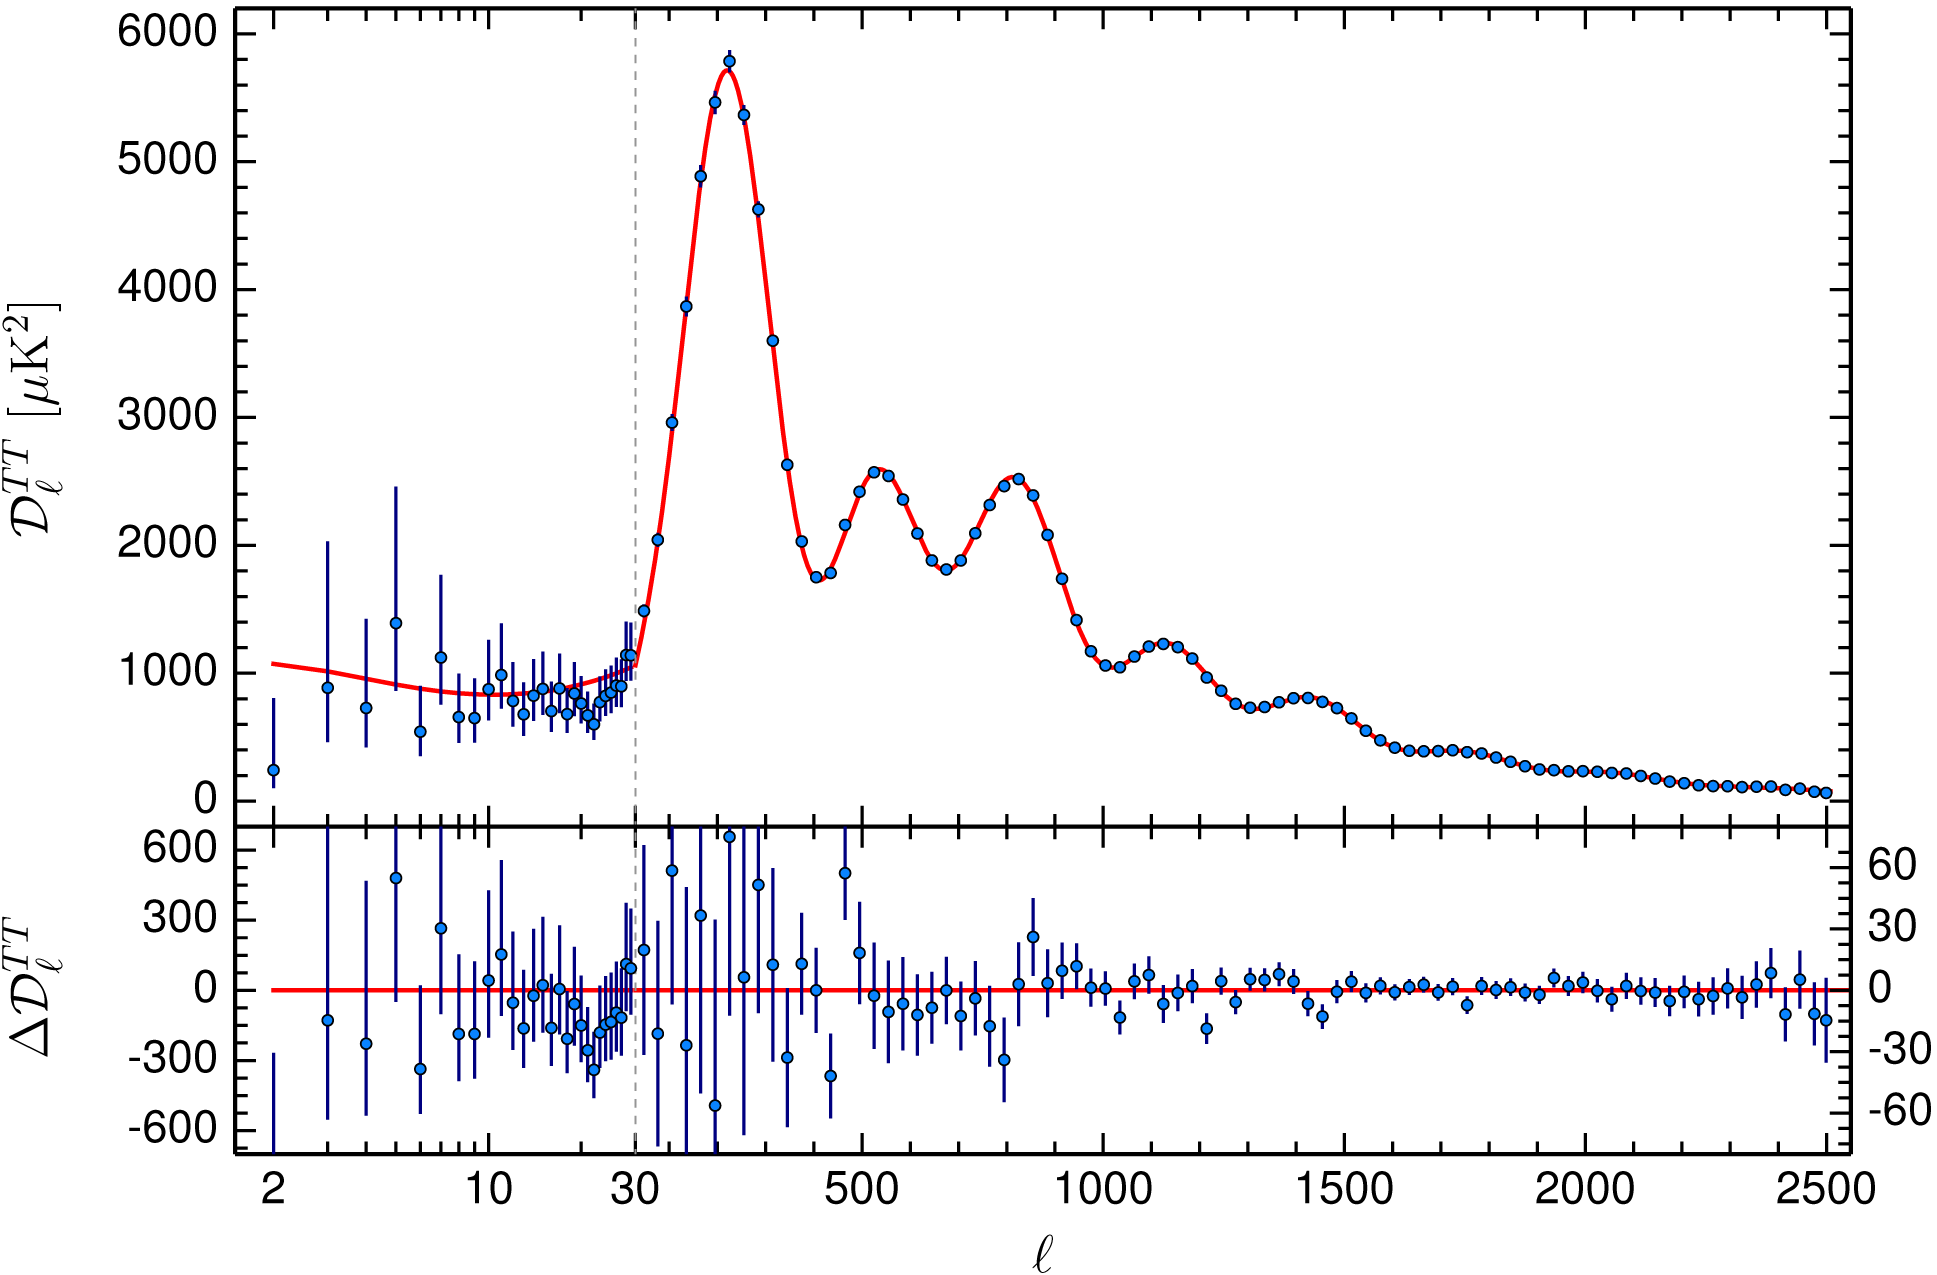
Is it possible to do a plot which is partially Plot and partially LogLinearPlot? The reference figure is
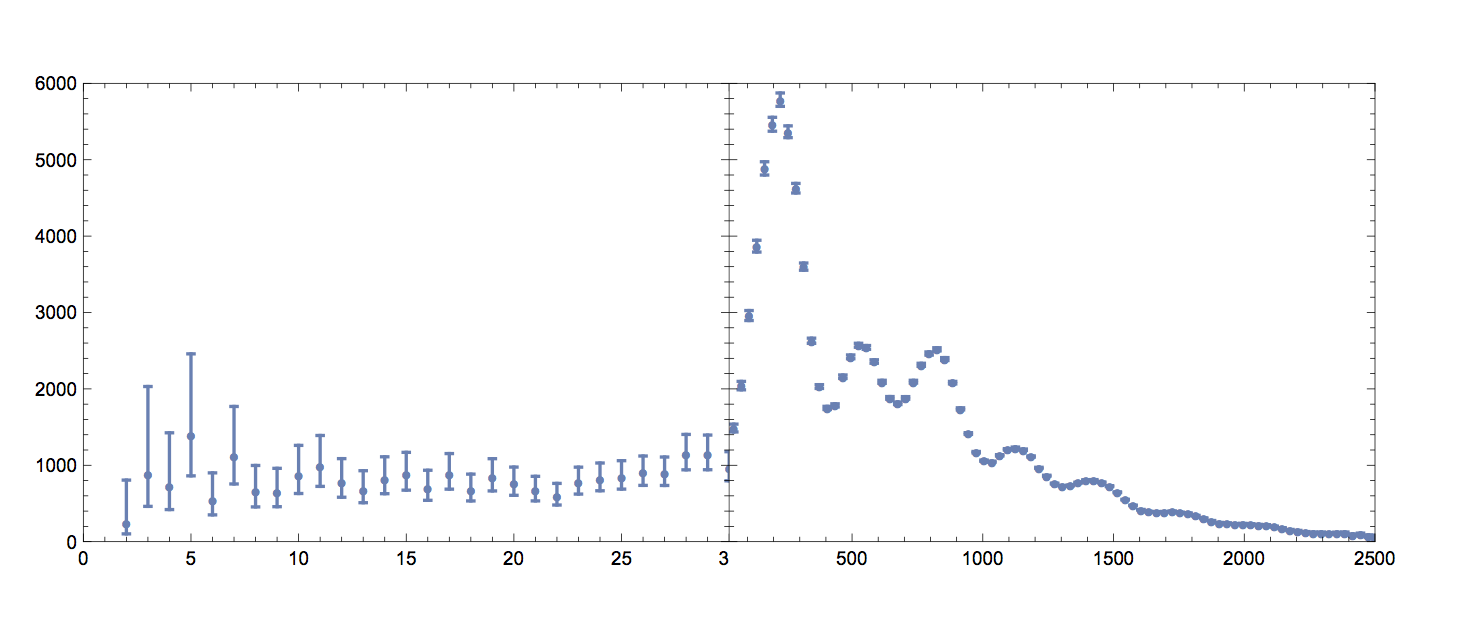
We see that the $x$-axis is logarithmic up to x = 30, and linear from there on. The only idea I came up with is to use the plotGrid function of this answer, but I am not really satisfied with the result, which is attached below.


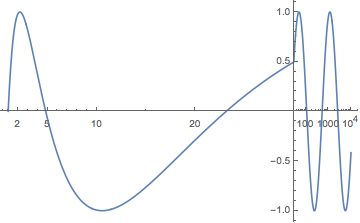
Piecewiseand custom ticks. $\endgroup$