0
$\begingroup$

I have created a couple of two-variable plots of the form f(x,y)=x*y where there's a number of result curves, each representing an answer (image example below).

Now, usually those plots have at least 10 curves, so it is imperative to have them labelled properly. I have come up with a solution of the form:

results = {10, 20, 50, 500};
range = {100, 3.5};
Plot[y = #1/x, {x, 0, range[[1]]}, PlotLabel -> "x*y", PlotRange -> {0, range[[2]]},
   Epilog -> Table[
        Inset[
            Framed[Results[[n]], Background -> White],
            {Sqrt[Results[[n]]*range[[1]]/range[[2]]], 
             Results[[n]]/Sqrt[Results[[n]]*range[[1]]/range[[2]]]
            }],
        {n, Dimensions[Results][[1]]}
    ]
] &@Results

This produces a following result:
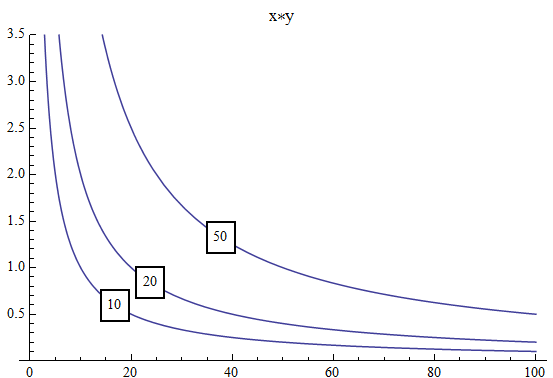
Labeled Plot

The seemingly confusing part when I specify the Inset coordinates is in fact a search of points where the result curves intersect with a linear function that cuts the plot quadrant in half.

I am satisfied with the aesthetics of this solution. I would like to duplicate the same plug-n-play effect for plots with log scaling: LogLinearPlot, LogPlot and LogLogPlot. However, after dabbling with it for the better part of today, I reached a moment when my confusion just made me forget everything and anything I know about log functions and plots. Anyone to the rescue?

 LogLinearPlot[y = #1/x, {x, 1, 1000}] &@Results
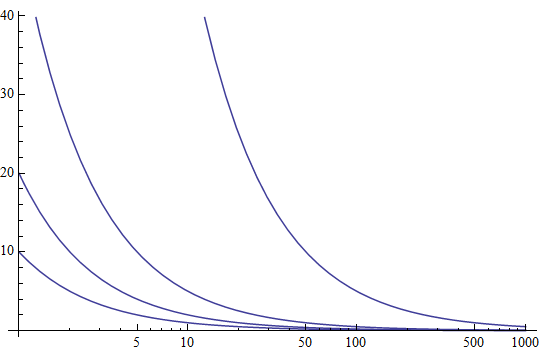
Unlabeled LogPlot

Thanks in advance, r.

$\endgroup$
3
  • $\begingroup$ In addition to inset labels you can use tooltips and mouseover to display your line labels. This might be preferable if you have lots of lines. (I suspect this would be a duplicate BTW) $\endgroup$ Commented Nov 11, 2013 at 21:01
  • $\begingroup$ I made this to interactively label the curves for these kind of situations $\endgroup$ Commented Nov 11, 2013 at 21:23
  • $\begingroup$ I guess this will be helpful: Labeling individual curves in Mathematica. $\endgroup$
    – Artes
    Commented Nov 11, 2013 at 21:30

3 Answers 3

2
$\begingroup$

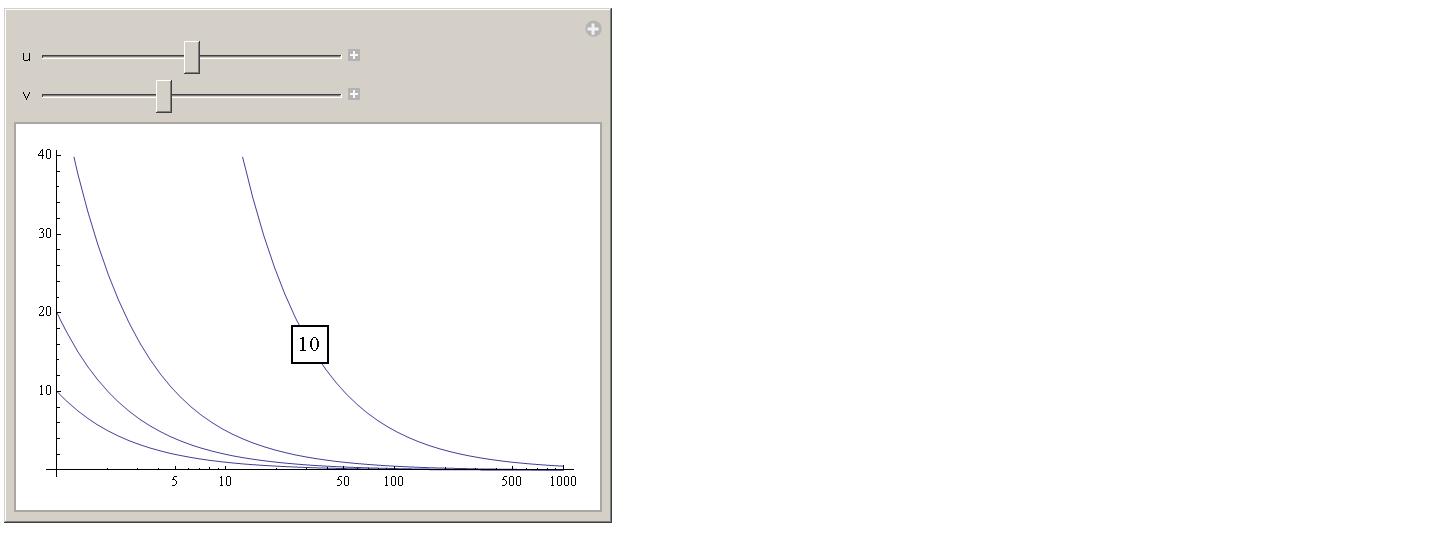
If I understood you right, one way could be to use manipulate to adjust the positions of your labels. Then you need to know nothing of how to calculate the coordinates. Try this, for example:

Manipulate[
 results = {10, 20, 50, 500};
 Show[{
   LogLinearPlot[(#1/x &@results), {x, 1, 1000}]
   }, Epilog -> 
   Inset[Framed[Style[First[results], 14], Background -> White], 
    Scaled[{u, v}]]], 
{{u, 0.5}, 0, 1}, {{v, 0.5}, 0, 1}]

Like this you may adjust all 10 labels in a matter of few minutes. You obtain this:enter image description here After you have adjusted all you need and inserted the coordinates into their places, remove the Manipulate.
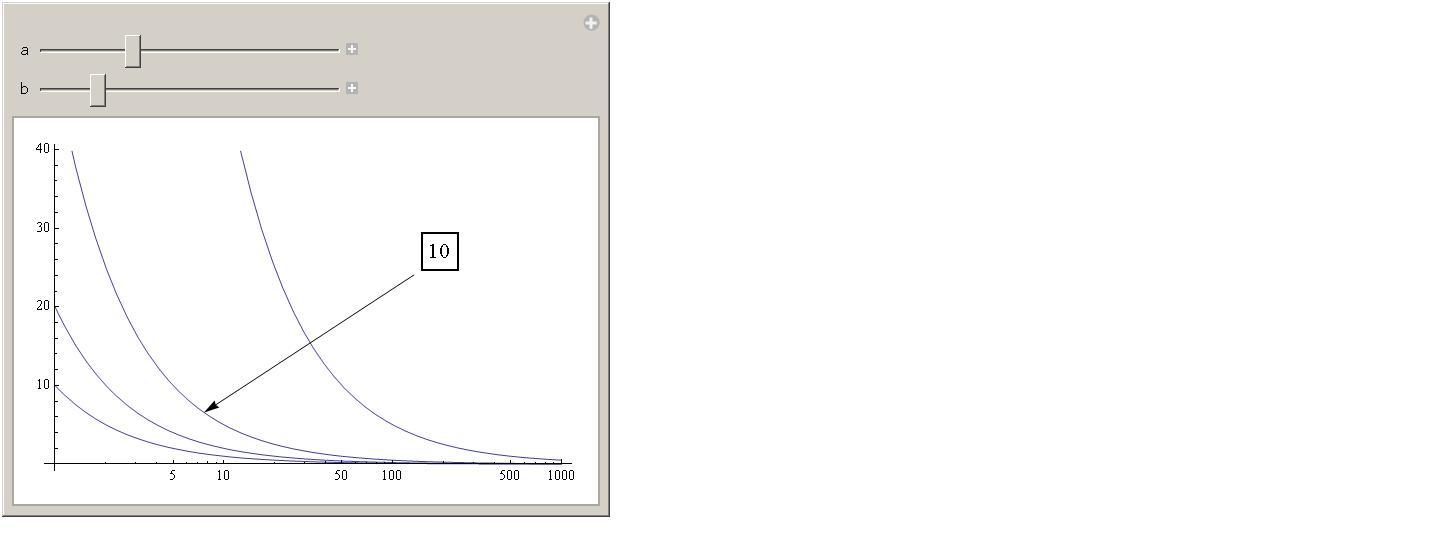
Another approach would be like this one:

Manipulate[
 results = {10, 20, 50, 500};
 Show[{
   LogLinearPlot[(#1/x &@results), {x, 1, 1000}],
   Graphics[{Arrowheads[0.03], 
     Arrow[{Scaled[{0.7, 0.6}], Scaled[{a, b}]}]}]
   }, Epilog -> 
   Inset[Framed[Style[First[results], 14], Background -> White], 
    Scaled[{0.75, 0.67}]]], {{a, 0.5}, 0, 1}, {{b, 0.5}, 0, 1}]

bringing up this: enter image description here

$\endgroup$
2
$\begingroup$

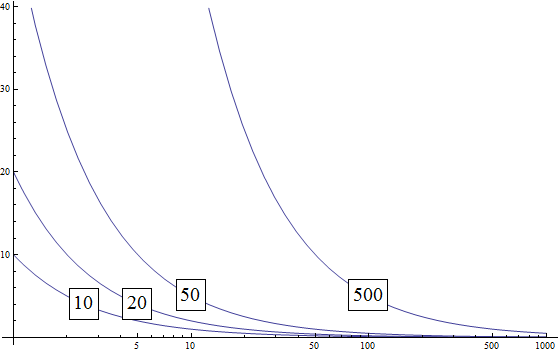
Modify to your stylistic preference:

results = {10, 20, 50, 500};
inset = MapThread[
  Inset[Framed[Style[#1, 20], 
     Background -> White], {Log@#2, #1/#2}] &, {results, {2.5, 5, 10, 
    100}}];    
LogLinearPlot[#1/x, {x, 1, 1000}, Epilog -> inset] &@results

enter image description here

$\endgroup$
0
$\begingroup$

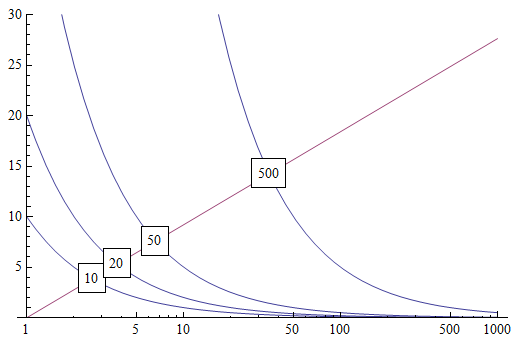
Basing on a hint from ubpdqn, I came up with a following idea:

LogLinearPlot[{y = #1/x, y = 4*Log[x]}, {x, 1, 1000}, 
  PlotRange -> {0, 30}, 
  Epilog -> Table[
      Inset[
      Framed[results[[n]], 
      Background -> White], 
      {Log[N[E^ProductLog[results[[n]]/4]]], 
      results[[n]]/N[E^ProductLog[results[[n]]/4]]}
      ], 
  {n,Dimensions[results][[1]]}]
] &@results

Substitute 4 for whatever fits best into your plot. This creates a pretty sweet effect:

Labelled LogLinearPlot

$\endgroup$

Your Answer

By clicking “Post Your Answer”, you agree to our terms of service and acknowledge you have read our privacy policy.

Not the answer you're looking for? Browse other questions tagged or ask your own question.