6
$\begingroup$

How can I have a region plot with the logarithmic axis? In the following, I have brought the original case which I want to be logarithmic. In this case, I have a density plot and a region plot that shows the realm of validity of the theory. I want to show this figure in logarithmic scales in order to be more clear.

η4=0.123663

 con14=-0.1 + 8 E^8 (-((5 μ)/(3 E^(40/3))) + (
 8 π η (BesselI[0, 4] BesselK[0, 4] - 
 BesselI[1, 4] BesselK[1, 4]))/E^8)
 con24=-12.4276 + μ
 con34=-((5 μ)/(3 E^(40/3))) + (
 8 π η (BesselI[0, 4] BesselK[0, 4] - 
 BesselI[1, 4] BesselK[1, 4]))/E^8
 con44=(35 μ)/(36 E^(16/3)) + 
 4 π η ((2 BesselI[0, 4] + 4 BesselI[1, 4]) BesselK[0, 
 4] - (4 BesselI[0, 4] + BesselI[1, 4]) BesselK[1, 4])

 pnrhs4=(1/(η Sqrt[
 161.08 η + 
 35. μ]))(-22.1002 η^(3/2) Sqrt[67.0519 η - 5. μ]
 Sqrt[μ] + 
 2.78971 μ^(
 5/2) + η^2 (-255.832 Sqrt[μ] - 
 0.764016 Sqrt[
 161.08 η + 35. μ]) + η (-240.094 μ^(3/2) + 
 1. Sqrt[161.08 η + 35. μ] + 
 0.00911946 μ Sqrt[161.08 η + 35. μ]))

 CPN4=(1/(η Sqrt[
 161.08 η + 
 35. μ]))(-22.1002 η^(3/2) Sqrt[67.0519 η - 5. μ]
 Sqrt[μ] + 
 2.78971 μ^(
 5/2) + η^2 (-255.832 Sqrt[μ] - 
 0.764016 Sqrt[
 161.08 η + 35. μ]) + η (-240.094 μ^(3/2) + 
 0.00911946 μ Sqrt[161.08 η + 35. μ]))

 QNN4=(60.1862 Sqrt[0.0216024 η + 0.00469384 μ] Sqrt[μ])/η

 Area4 = RegionPlot[{con14 < 0 && con24 < 0 && con34 > 0 && con44 > 0 &&
 Abs[CPN4] < 1 && QNN4 > 0}, {μ, 0, 0.028}, {η, 
 0, η4}, BoundaryStyle -> {Green}, PlotStyle -> {None}, 
 FrameLabel -> Automatic]

 P4 = Show[
 DensityPlot[(QNN4/pnrhs4), {μ, 0, 0.028}, {η, 0, η4}, 
 PlotRange -> {0, 75}, PlotPoints -> 300, 
 PlotRangePadding -> {Automatic, 0.00015}, 
 FrameLabel -> {Style[μ, FontSize -> 14, Blue], 
 Style[η, FontSize -> 14, Blue]}, 
 BaseStyle -> {FontWeight -> Bold, FontSize -> 17}, 
 ColorFunction -> "SunsetColors", 
 PlotLegends -> 
 BarLegend[Automatic, LegendMarkerSize -> 230, LegendMargins -> 5, 
 LegendLabel -> Style["Q/(1+C)", FontSize -> 16], 
 LabelStyle -> {Bold, FontSize -> 14}], 
 FrameTicks -> {{{0, 0.04, 0.08, 0.12}, 
 None}, {{0, 0.006, 0.012, 0.018, 0.024}, None}}], Area4]

Thank you for your help.

$\endgroup$
1
  • $\begingroup$ Hi @Jason B. :) $\endgroup$ Commented Jun 21, 2018 at 15:22

2 Answers 2

5
$\begingroup$

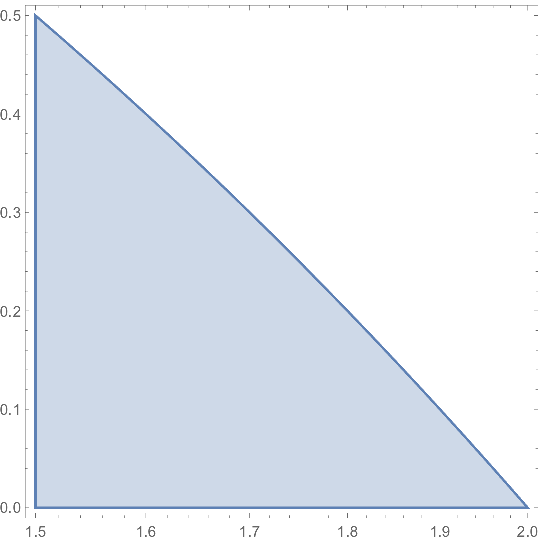
Apparently, RegionPlot does not support ScalingFunctions. It does, but it has to be convinced a little, it applies the scaling functions only to the axes, and also neither the syntax highlighter nor the documentation know about it. Here is a possible workaround (at least for version 11.3).

reg = ImplicitRegion[ x + y <= 2 && x^2 + y >= 1 && Abs[x] >= 3/2, {{x, 0, 10}, {y, 0, 10}}];
R = BoundaryDiscretizeRegion[reg];
S = MeshRegion[{Log[#[[1]]], #[[2]]} & /@ MeshCoordinates[R], 
   MeshCells[R, RegionDimension[R]]];
RegionPlot[S, ScalingFunctions -> {"Log", "Linear"}, Axes -> True]

enter image description here

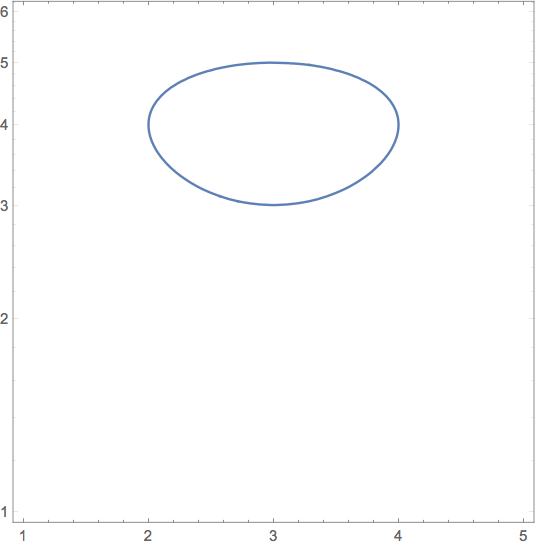
CountourPlot accepts ScalingFunctions and seems to process them correctly, at least in version 11.3, e.g.

ContourPlot[(x - 3)^2 + (y - 4)^2 == 1, {x, 1, 5}, {y, 1, 6},
 ScalingFunctions -> {"Linear", "Log"}
 ]

enter image description here

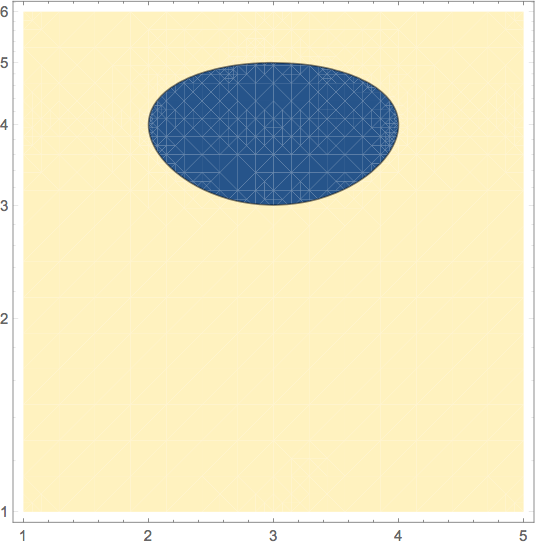
ContourPlot[(x - 3)^2 + (y - 4)^2, {x, 1, 5}, {y, 1, 6},
 ScalingFunctions -> {"Linear", "Log"},
 Contours -> {1}
 ]

enter image description here

$\endgroup$
3
  • $\begingroup$ It's worth to mention your version. In v11.3 both codes work; but in v10.4 the first one kills the kernel, and the second produces an empty plot. $\endgroup$
    – corey979
    Commented Jun 20, 2018 at 7:45
  • $\begingroup$ Good point. I'll mention that. $\endgroup$ Commented Jun 20, 2018 at 7:46
  • $\begingroup$ @HenrikSchumacher: I need a region that some constraints are satisfied where. for example x+y<2 && x^2+y>1 && Abs[x]>2. Is it possible in contour plot? $\endgroup$ Commented Jun 20, 2018 at 7:54
4
$\begingroup$

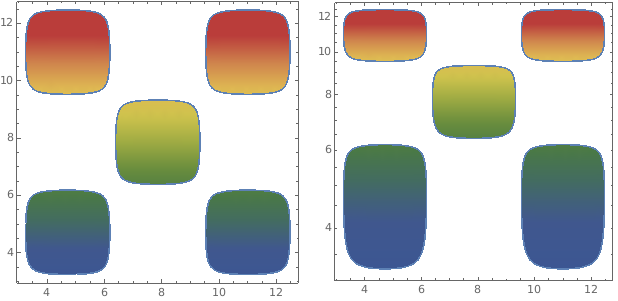
You can post-process RegionPlot output to rescale the desired coordinate of graphics primitives:

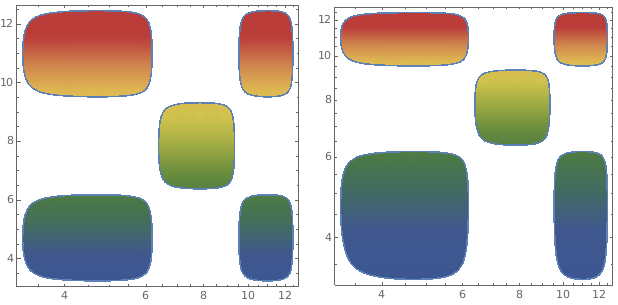
rp = RegionPlot[Sin[x] Sin[y] > 1/10, {x, Pi, 4 Pi}, {y, Pi, 4 Pi}, 
   ColorFunction -> "DarkRainbow", ImageSize -> 300]; 
Row[{rp, 
 Show[rp /. GraphicsComplex[c_, prims___] :> GraphicsComplex[{#, Log @ #2}& @@@ c, prims],
   FrameTicks -> {{Charting`ScaledTicks[{Log, Exp}], 
     Charting`ScaledFrameTicks[{Log, Exp}]}, {Automatic, Automatic}} , 
   PlotRange -> All]}, Spacer[10]] 

enter image description here

Replace {#, Log @ #2}& @@@ c with {Log @ #, #2} & @@@ c to use Log scale on the horizontal axis, and with {Log @ #, Log @ #2} & @@@ c to have both axes in Log scale. With appropriate modifications of the FrameTicks settings we get

enter image description here

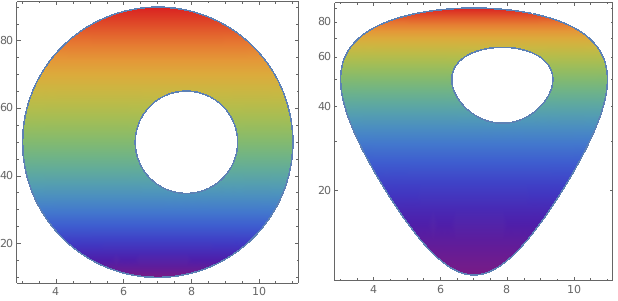
Another example:

rp = RegionPlot[2 < Abs[ ((x -3 + I  (y/10-5))/10 - 2)/( 2(x-3 + I (y/10-5)) /10- 1)] <5, 
 {x, 3, 20}, {y, 1, 200}, 
 ColorFunction -> "Rainbow", ImageSize -> 300, PlotRange -> All, PlotPoints -> 50]

we get

enter image description here

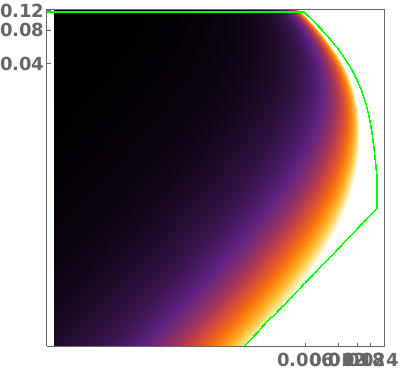
Update: Adding the option ScalingFunctions -> {"Log", "Log"} to OP's DensityPlot and using post-processing idea on OP's Area4:

dp2 = DensityPlot[(QNN4/pnrhs4), {μ, 0, 0.028}, {η, 0, η4},
  PlotRange -> {0, 75}, PlotPoints -> 100, 
  PlotRangePadding -> {Automatic, 0.00015}, 
  BaseStyle -> {FontWeight -> Bold, FontSize -> 17}, 
  ColorFunction -> "SunsetColors", 
  FrameTicks -> {{{0, 0.04, 0.08, 0.12},  None}, {{0, 0.006, 0.012, 0.018, 0.024}, None}},
  ScalingFunctions -> {"Log", "Log"}]; 

  Show[dp2, Area4 /.  GraphicsComplex[c_, prims___] :> 
        GraphicsComplex[{Log@#, Log@#2} & @@@ c, {Thick, prims}], ImageSize -> 600]  

enter image description here

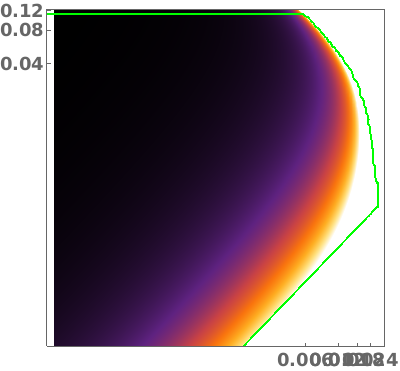
To confirm that post-processing gives the correct picture, compare the above result to the one obtained using ContourPlot with ScalingFunctions-> {"Log", "Log"} with Boole[con14 <= 0 && con24 <= 0 && con34 >= 0 && ...] as the first argument:

Area4b = ContourPlot[Boole[con14 <= 0 && con24 <=  0 && con34 >= 0 && con44 >=  0 &&
     Abs[CPN4] <=  1 && QNN4 >=  0], 
  {μ, 0.00001, 0.028}, {η, 0.00001, η4}, ContourStyle -> Green, 
  Contours -> {1}, PlotPoints -> 50, ScalingFunctions -> {"Log", "Log"}, 
  ContourShading -> {None, Opacity[.5, Yellow]}];

 bdg = BoundaryDiscretizeGraphics[Area4b,
   MeshCellStyle -> {2 -> None, 1 -> Directive[Thick, Green]}];

 Show[dp2, bdg, ImageSize -> 400] 

enter image description here


$\endgroup$
6
  • $\begingroup$ Thank U, but it didn't work out for my problem. I want {con14 < 0 && con24 < 0 && con34 > 0 && con44 > 0 && Abs[CPN4] < 1 && QNN4 > 0}, {\[Mu], 0, 0.028}, {\[Eta], 0, \[Eta]4} $\endgroup$ Commented Jun 20, 2018 at 10:20
  • $\begingroup$ Dear @kglr I want both axes to be logarithmic. On the other hand above command does n't have Thicks. Isn't the shape ugly?! :/ $\endgroup$ Commented Jun 20, 2018 at 10:30
  • $\begingroup$ ... if you want to have Log scale for both axes use Show[ rp /. GraphicsComplex[c_, prims___] :> GraphicsComplex[{Log@#, Log@#2} & @@@ c, prims], FrameTicks -> {{Charting`ScaledTicks[{Log, Exp}], Charting`ScaledFrameTicks[{Log, Exp}]}, {Charting`ScaledTicks[{Log, Exp}], Charting`ScaledFrameTicks[{Log, Exp}]}}, PlotRange -> All, ImageSize -> 300] $\endgroup$
    – kglr
    Commented Jun 20, 2018 at 10:30
  • $\begingroup$ Dear @kglr: Thanks for your important help. Is it exactly (mathematically) true? I really appreciate you. $\endgroup$ Commented Jun 20, 2018 at 10:34
  • $\begingroup$ @PerfectFluid, can't say anything re "Is it exactly (mathematically) true":) If you apply the same post-processing to the ContourPlot version of the first example above and compare the result to ContourPlot[... ScalingFunctions->{None,"Log"}] you do get the same result. $\endgroup$
    – kglr
    Commented Jun 20, 2018 at 11:03

Your Answer

By clicking “Post Your Answer”, you agree to our terms of service and acknowledge you have read our privacy policy.

Not the answer you're looking for? Browse other questions tagged or ask your own question.