5
$\begingroup$

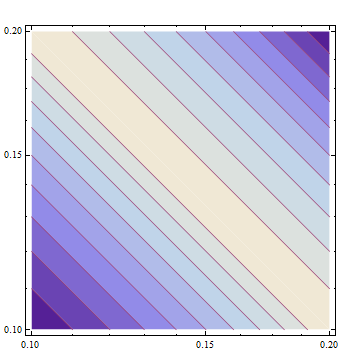
My current code is:

data = {{0.1, 0.1, 2}, {0.1, 0.2, 1}, {0.2, 0.1, 1}, {0.2, 0.2, 2}};
ListContourPlot[data, Mesh -> None, PlotRange -> All, 
 InterpolationOrder -> 3, 
 ColorFunction -> ColorData[{"LakeColors", "Reverse"}]]

It produces the following figure:
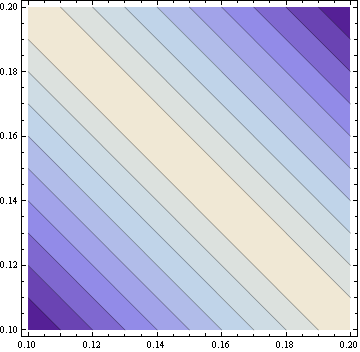
enter image description here

I want to scale the linear x and y axes to a log scale without converting to log units.

There is a ListLogLogPlot function but no corresponding ListLogLogContourPlot function.

I have read several relevant threads:

However, they are all for ContourPlot rather than ListContourPlot.

I tried to use way suggested by How does one set a logarithmic scale in a ContourPlot?:

data = {{0.1, 0.1, 2}, {0.1, 0.2, 1}, {0.2, 0.1, 1}, {0.2, 0.2, 2}};
pl = Normal@
  ListContourPlot[data, Mesh -> None, PlotRange -> All, 
   InterpolationOrder -> 3, 
   ColorFunction -> ColorData[{"LakeColors", "Reverse"}]]
ListLogLogPlot[Cases[pl, Line[a_, b___] :> a, Infinity], 
 Joined -> True, Frame -> True, PlotRange -> All, AspectRatio -> 1, 
 PlotStyle -> ColorData[1][2]]

However, it only produces the following, in which the density color background is lost, leaving only lines:
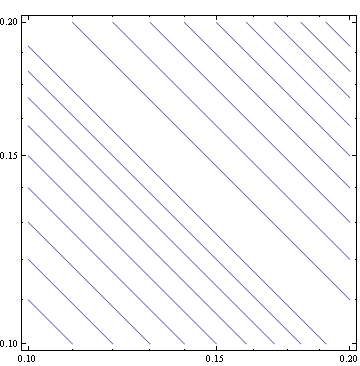
enter image description here

The way suggested by http://forums.wolfram.com/mathgroup/archive/2006/Jun/msg00585.html by using FrameTicks functions seems promising. But, it is for ContourPlot. I do not know how to adopt it to be used in ListContourPlot.

Helps are much appreciated.

$\endgroup$

3 Answers 3

3
$\begingroup$

You could extract FrameTicks using AbsoluteOptions and convert it to log scale. I used different data set to see log scale more easily:

data = 
  Flatten[Table[{x, y, Sin[3 x] + Cos[3 y]}, {x, .1 Pi, 2 Pi, .2}, {y, .01 Pi, 2 Pi, .2}], 1];

pdata = ListContourPlot[data, Mesh -> None, PlotRange -> All, InterpolationOrder -> 3];

ticks = FrameTicks /. AbsoluteOptions[pdata, FrameTicks];

logticks = Apply[If[#1 == 0, {#1, , ##3}, {Log[10, #1], ##2}] &, ticks, {2}];

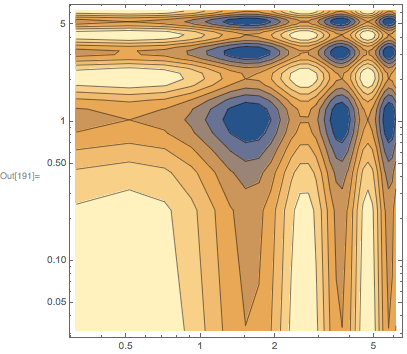
ListContourPlot[{Log[10, #1], Log[10, #2], #3} & @@@ data, 
  Mesh -> None, PlotRange -> All, InterpolationOrder -> 3, 
  ColorFunction -> ColorData[{"LakeColors", "Reverse"}], 
  FrameTicks -> logticks]

enter image description here

$\endgroup$
3
  • $\begingroup$ This one is exactly what I want. Thanks. $\endgroup$ Commented Oct 29, 2013 at 21:58
  • 4
    $\begingroup$ Under Mathematica 10, I am getting error "Ticks::ticks: "{Automatic,Automatic} is not a valid tick specification." and no ticks are shown. Does anybody know how to fix this? Thanks. $\endgroup$
    – Irigi
    Commented Oct 23, 2014 at 15:42
  • $\begingroup$ I'm having the same issue with Mathematica 10.2 : "Ticks::ticks: "{Automatic,Automatic} is not a valid tick specification." $\endgroup$
    – sekisushai
    Commented May 6, 2016 at 21:50
3
$\begingroup$

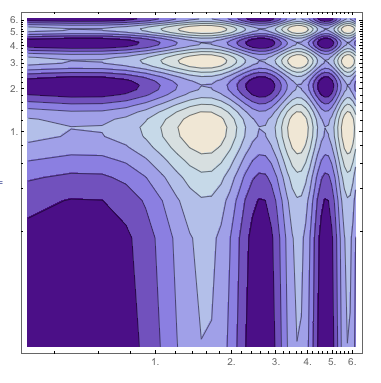
In M11.2, you can just use the ScalingFunctions option:

data = Flatten[
    Table[{x,y,Sin[3 x]+Cos[3 y]},{x,.1 Pi,2 Pi,.2},{y,.01 Pi,2 Pi,.2}],
    1
];

ListContourPlot[
    data,
    ScalingFunctions -> {"Log","Log"},
    Mesh->None, PlotRange->All, InterpolationOrder->3
]

enter image description here

$\endgroup$
1
  • $\begingroup$ I just love it! I wish all plotting & graphics functions had ScalingFunction options and the mess with LogLog, Log and LogLinear would end forever! $\endgroup$
    – Johu
    Commented Sep 17, 2018 at 11:03
1
$\begingroup$

It's very ugly way but sometimes it is good to have it rather than nothing.

It's about manually taking Polygons and plotting them with Log10 applied to vertices. To not bother with creating custom ticks I've just used Overlay with ImagePadding to set everything straight:

Overlay[{
         Graphics[(pl[[1, 1]] /. x : {_?NumberQ ..} :> Log10[x]), ImagePadding -> 25],
         ListLogLogPlot[Cases[pl, Line[a_, b___] :> a, Infinity], Joined -> True, 
                        Frame -> True, PlotRange -> All, ImagePadding -> 25, 
                        AspectRatio -> 1, PlotStyle -> ColorData[1][2]]
        }]

enter image description here

$\endgroup$
0

Your Answer

By clicking “Post Your Answer”, you agree to our terms of service and acknowledge you have read our privacy policy.

Not the answer you're looking for? Browse other questions tagged or ask your own question.