3
$\begingroup$

For a function I am plotting I can get a RegionPlot[f[x, y] > 100] but if I do ContourPlot[f[x, y], Contours -> {1, 10, 100, 1000}] in the same $x$ and $y$ ranges, only the contours for 1 and 10 are drawn, not the ones for 100 and 1000. I know that these two contours exists because RegionPlot finds them, so, what options of ContourPlot should I use to get the plot done?

For an example please try ContourPlot[0.000157223 10^(2 x - 2 y), {x, -6, -1}, {y, -6, -1}, Contours -> { 100}, ContourShading -> False]

$\endgroup$
9
  • 2
    $\begingroup$ So, um, can I see what f looks like? :-) $\endgroup$
    – Jason B.
    Commented Mar 24, 2016 at 16:01
  • $\begingroup$ try PlotPoints $\endgroup$
    – george2079
    Commented Mar 24, 2016 at 16:02
  • $\begingroup$ @JasonB The specific f I have today is something you do not want to look at :) it comes from a long manipulation of inputs. $\endgroup$
    – Rho Phi
    Commented Mar 24, 2016 at 16:07
  • 1
    $\begingroup$ Roberto, as you can see, we are shooting blind here. We need to have access to the function, or even better, to a minimal working example that exhibits the same problem, to provide meaningful help. $\endgroup$
    – MarcoB
    Commented Mar 24, 2016 at 16:15
  • 1
    $\begingroup$ Interestingly, ContourPlot[0.000157223 10^(2 x - 2 y) == 100, {x, -6, -1}, {y, -6, -1}] does plot the contour. $\endgroup$
    – user484
    Commented Mar 24, 2016 at 16:32

3 Answers 3

6
$\begingroup$

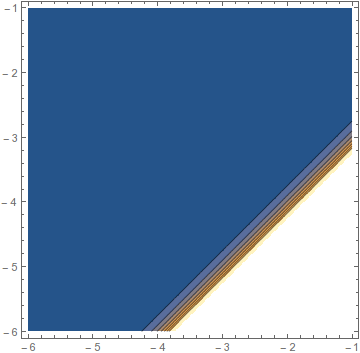
Ah, what's happening is that the contour you want is outside the automatically chosen PlotRange. Observe:

ContourPlot[0.000157223 10^(2 x - 2 y), {x, -6, -1}, {y, -6, -1}]

enter image description here

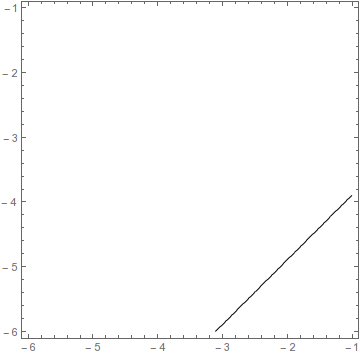
The contour you want would be in the white part, whose values are extremely high compared to the automatically drawn contours. Instead you have to force the PlotRange to contain the contour, for example by setting it to All:

ContourPlot[0.000157223 10^(2 x - 2 y), {x, -6, -1}, {y, -6, -1}, Contours -> {100},
 ContourShading -> None, PlotRange -> {Full, Full, All}]

enter image description here

$\endgroup$
1
  • $\begingroup$ Thanks for posting as answer! (+1) $\endgroup$
    – MarcoB
    Commented Mar 24, 2016 at 16:53
5
$\begingroup$

Working blind.. here is a little trick to let you visualize where ContourPlot evaluates your function and help you find appropriate settings for PlotPoints and MaxRecursion. I think MaxRecursion doesn't help if it doesn't even spot the countour on first pass.

cv = 3/4;
Show[
 MapAt[Graphics[{If[#[[3]] > cv, Red, Blue], 
       Point[#[[1 ;; 2]]]} & /@ #[[1]]] &,
  Reap[ContourPlot[  (fv = Sin[x] Cos[y]) == cv , 
      {x, -4, 4}, {y, -4, 4},
    EvaluationMonitor :> Sow[{x, y, fv}],
    MaxRecursion -> 2, PlotPoints -> 5]], {2}]]
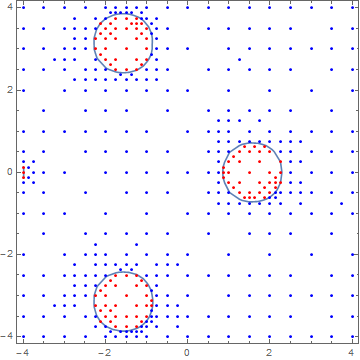
enter image description here

Applying this to your example,

cv = 100;
Show[
 MapAt[Graphics[{If[#[[3]] > cv, Red, Blue], 
       Point[#[[1 ;; 2]]]} & /@ #[[1]]] &,
  Reap[ContourPlot[
    fv = 0.000157223 10^(2 x - 2 y), {x, -6, -1}, {y, -6, -1}, 
    Contours -> {1, 10, 100, 1000}, 
    EvaluationMonitor :> Sow[{x, y, fv}], 
    ContourShading -> None]], {2}]]
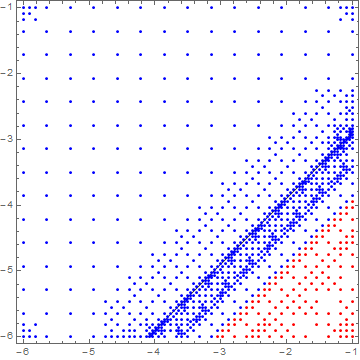
enter image description here

you see it is finding the contours just fine so it seems like a glitch in contourshading. (I tried playing with ContourStyle with no success )

As noted by @Rahul in comments this works:

ContourPlot[ 0.000157223 10^(2 x - 2 y) == {1, 10, 100,  1000},
  {x, -6, -1}, {y, -6, -1}]
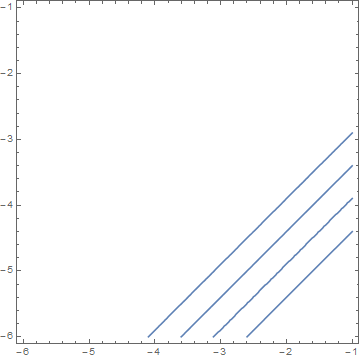
enter image description here

$\endgroup$
1
$\begingroup$

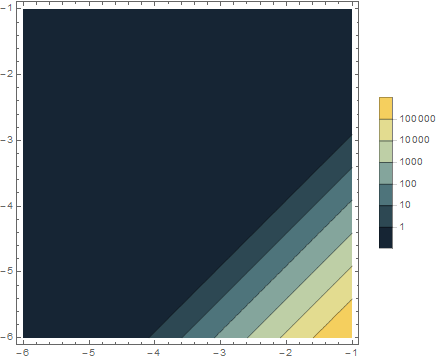
With shading and legend.

ContourPlot[0.00015 10^(2 x - 2 y), {x, -6, -1}, {y, -6, -1}, 
 Contours -> {1, 10, 100, 1000, 10000, 100000},
 ColorFunctionScaling -> False,
 ColorFunction -> (ColorData["StarryNightColors"][Rescale[Log10[#], {0, 6}]] &),
 PlotRange -> Full,
 PlotLegends -> Automatic]

![enter image description here

$\endgroup$

Your Answer

By clicking “Post Your Answer”, you agree to our terms of service and acknowledge you have read our privacy policy.

Not the answer you're looking for? Browse other questions tagged or ask your own question.