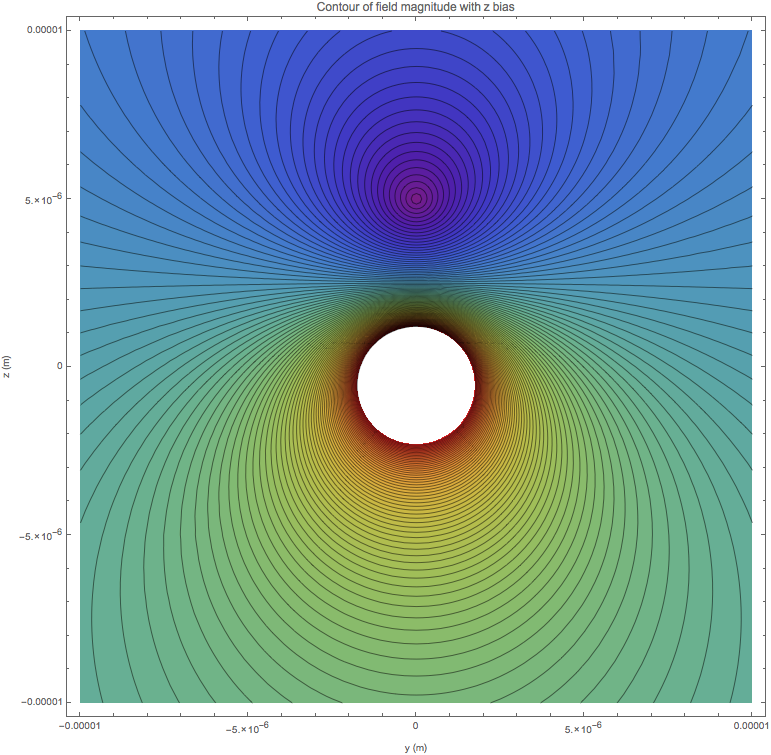
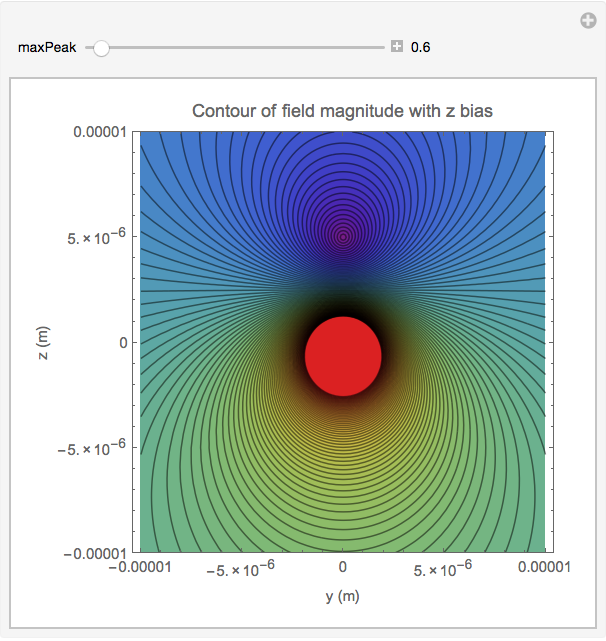
When I try to create a ContourPlot of the magnitude of the following vector I get a white area that should be filled with values.
Running the following code:
Bx := 0
By[y_, z_] := (\[Mu]0*j*(y - dy))/(2*Pi ((y - dy)^2 + (z - dz)^2))
Bz[y_, z_] := (\[Mu]0*j*(z - dz))/(2*Pi ((y - dy)^2 + (z - dz)^2))

bwi3D[y_, z_] := {Bx, By[y, z], Bz[y, z]}

bb3Dz = {0, 0, -(\[Mu]0*j)/(2 Pi 5 10^-6)}

const = {\[Mu]0 -> 4 Pi*10^-7, \[Chi] -> -4.5 *10^-4};

params = {j -> 5, V -> (25*10^-18), dz -> 0, dy -> 0};

b3Dz[y_, z_] := bwi3D[y, z] + bb3Dz /. const /. params

ContourPlot[Sqrt[(b3Dz[y, z][[2]] /. const /. params)^2 + (b3Dz[y, z][[3]] /. const /.params)^2],
      {y, -10 (10^-6), 10*(10^-6)}, {z, -10 (10^-6), 10*(10^-6)},
      ColorFunction -> "Rainbow", Contours -> 100, FrameLabel -> {"y (m)", "z (m)"},
      PlotLabel -> "Contour of field magnitude with z bias"]
I get a contour that looks like this:

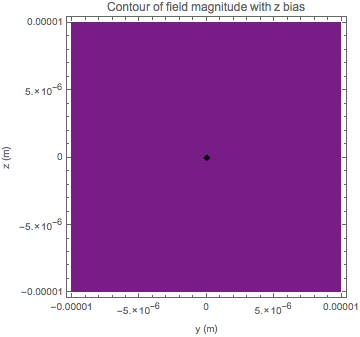
Zooming in reveals contours in regions that were previously engulfed in this white area and using PlotRange -> All results in the following monstrosity:

I think this issue is tied to the fact that there is a singularity in this function at y=0 and z=0, but I don't know how to exclude this point. I also have no clue why PlotRange->All is resulting in an all purple plot.
Any help would be appreciated.
Edit: Thanks for bearing with me while I added all the code and fixed the formatting


Bx := 0 By[y_, z_] := (\[Mu]0*j*(y - dy))/(2*Pi ((y - dy)^2 + (z - dz)^2)) Bz[y_, z_] := (\[Mu]0*j*(z - dz))/(2*Pi ((y - dy)^2 + (z - dz)^2)) bwi3D[y_, z_] := {Bx, By[y, z], Bz[y, z]} const = {\[Mu]0 -> 4 Pi*10^-7, \[Chi] -> -4.5 *10^-4}; params = {j -> 5, V -> (25*10^-18), dz -> 0, dy -> 0}; b3Dz[y_, z_] := bwi3D[y, z] + bb3Dz /. const /. paramsI think this should be enough to reproduce this code? Also it doesn't recognise Clipping as a function. Thank you for your reply. $\endgroup$