2
$\begingroup$

Assume there are three groups of 2-dimensional coordinates

data = RandomVariate[NormalDistribution[#, .25], {15, 2}] & /@ Range[3];

Is there a way to ListPlot these data points just like

ListPlot[data, PlotStyle -> {Red, Blue, Green}]
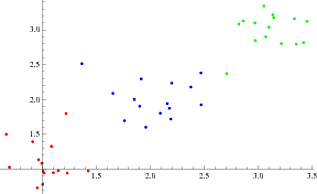
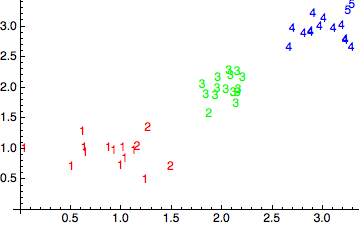
but instead of the dots with the result of an integer-valued function, e.g. Round[Norm[#]]&, shown in the according colour?

I already had a look at this and that question, but wasn't able to modify the answers to obtain the desired result.

$\endgroup$
2
  • 1
    $\begingroup$ you want numbers instead of the points? $\endgroup$
    – rm -rf
    Commented Aug 15, 2012 at 16:41
  • $\begingroup$ Yes, each point should be the number resulting in applying to it a pre-defined function f:R^2 -> N in the colour as shown above. $\endgroup$ Commented Aug 15, 2012 at 16:48

3 Answers 3

5
$\begingroup$

Not sure if this is what you had in mind, but you could do something like

ListPlot[data, PlotStyle -> {Red, Green, Blue}] /. 
   {Point[a_] :> (Text[Round[Norm[#]], #] & /@ a)}

Mathematica graphics

$\endgroup$
3
  • $\begingroup$ I think there was a question by Mr.W in SO showing that the points aren't shown in their correct positions with this technique. If my memory does not fail, the trick was rasterizing the symbols before plotting. Mmm ... I should check $\endgroup$ Commented Aug 15, 2012 at 16:59
  • $\begingroup$ @Verde I missed that question. If I superpose the original ListPlot on top of the one above, the numbers seem to be shifted slightly with respect to the dots by a few pixels. I wonder what causes this. $\endgroup$
    – Heike
    Commented Aug 15, 2012 at 17:13
  • 1
    $\begingroup$ @Verde This is probably the question you're thinking of... $\endgroup$
    – rm -rf
    Commented Aug 15, 2012 at 17:18
7
$\begingroup$

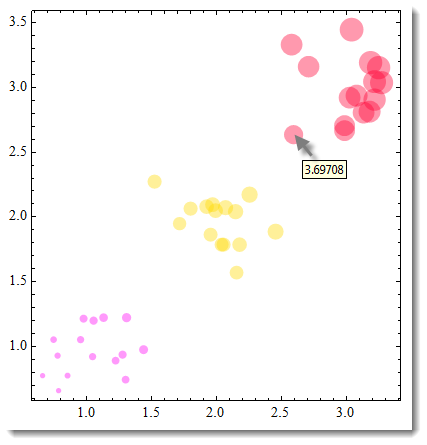
The numbers will confusingly overlap, especially with more precision shown. Just in case here is a solution with radius of disk reflecting the Norm and Tooltip showing the number?

Graphics[{Hue[RandomReal[], 1, 1, .4], 
    Map[Tooltip[Disk[#, .02 Norm[#]], Norm[#]] &, #]} & /@ data, Frame -> True]

enter image description here

$\endgroup$
0
$\begingroup$
SeedRandom[1]
data = RandomVariate[NormalDistribution[#, .25], {15, 2}] & /@ Range[3];

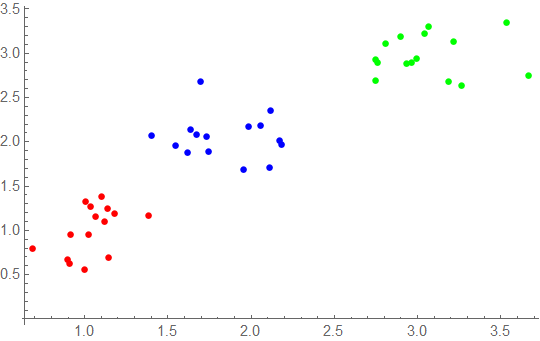
ListPlot[data, PlotStyle -> {Red, Blue, Green}]

enter image description here

data2 = Flatten[data, {2, 1}];
(* or data2 = Join @@ Transpose[data] *)

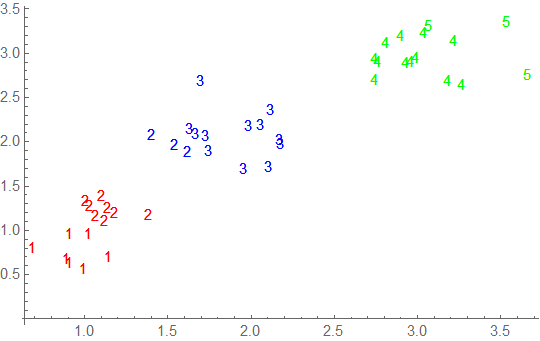
ListPlot[List /@ data2,
 PlotStyle -> {Red, Blue, Green}, 
 PlotMarkers -> (Round[Norm @ #] & /@ data2)]

enter image description here

$\endgroup$

Your Answer

By clicking “Post Your Answer”, you agree to our terms of service and acknowledge you have read our privacy policy.

Not the answer you're looking for? Browse other questions tagged or ask your own question.