5
$\begingroup$

I have a dataset consisting of points on the plane and a corresponding color. These colors divide the plane into a few distinct regions. I would like to make a plot or diagram that nicely shows this breakdown into colored regions.

To generate some example data,

incircle[x_, y_] := Piecewise[{{Red, x^2 + y^2 <= 25 }, {Blue, x^2 + y^2 > 25 }}];
data = Table[{i, j, incircle[i, j]}, {i, -10, 10, 1}, {j, -10, 10, 1}];
data = ArrayReshape[data, {441, 3}];

(*{{-10,-10,Blue},{-10,-9,Blue},{-10,-8,Blue},{-10,-7,Blue},...*)

This gives a list where each entry is a pair of x,y coordinates, and then red or blue depending on whether or not the coordinates are within a circle of radius five.

I can then make a list of coordinates and list of colors, and plot them accordingly using listplot:

pdat = {{#[[1]], #[[2]]}} & /@ data;
pcol = #[[3]] & /@ data;
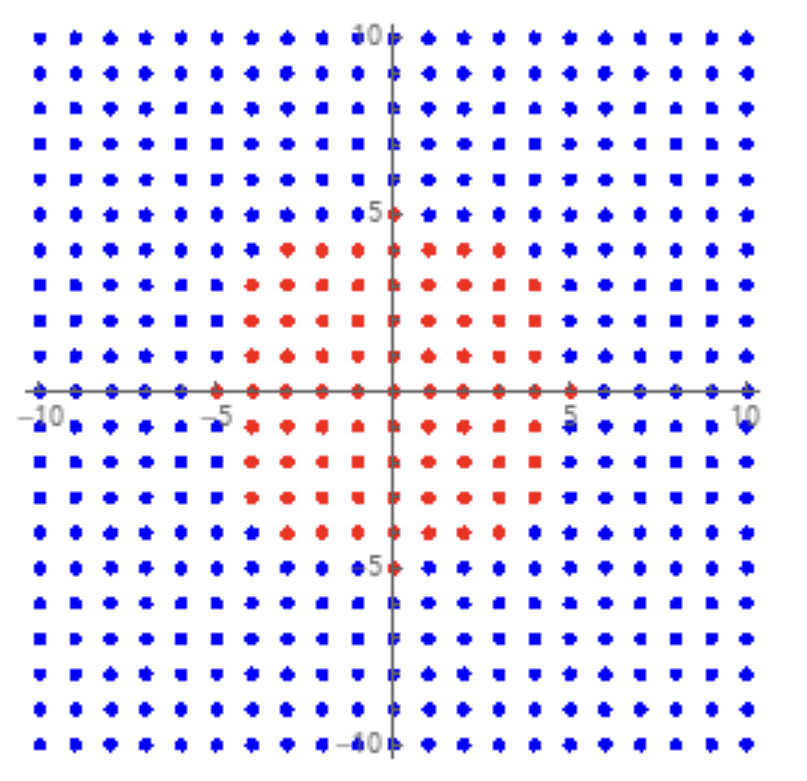
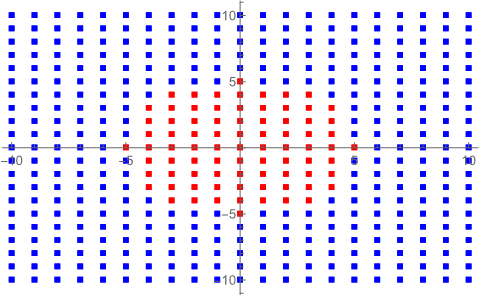
ListPlot[pdat, PlotStyle -> pcol, PlotMarkers -> "\[FilledSquare]", ImageSize -> {250, 250}]

enter image description here

Which gives me a red circular region. Is there anyway to color each region according to the list more nicely and continuously, preserving a definite boundary between each region? My actual data is much more sporadic so the boundary between regions can be much more complex than a circle.

$\endgroup$
4
  • $\begingroup$ VertexColors? $\endgroup$ Commented Aug 13, 2020 at 6:55
  • $\begingroup$ It looks like vertexcolors blend colors together between the different regions. Is there a way to preserve a definite boundary between each region? $\endgroup$
    – Cheyne
    Commented Aug 13, 2020 at 7:00
  • $\begingroup$ if each is defined as a point, I don’t think this interpolation should happen. However, if you know certain regions will have certain colors, you might find a way to use a ColorFunction. $\endgroup$ Commented Aug 13, 2020 at 7:10
  • $\begingroup$ Hmmm yes maybe I could do something with colorfunction if I put all my data in a matrix and use arrayplot... $\endgroup$
    – Cheyne
    Commented Aug 13, 2020 at 7:21

3 Answers 3

5
$\begingroup$

Convex hull mesh

coords = CoordinateBoundsArray[{{-10, 10}, {-10, 10}}];
in = Select[Flatten[coords, 1], Norm@# <= 5 &];
out = Select[Flatten[coords, 1], Norm@# > 5 &];

p1 = Cases[Normal@ConvexHullMesh[out]["Graphics"], _Polygon, Infinity];
p2 = Cases[Normal@ConvexHullMesh[in]["Graphics"], _Polygon, Infinity];

Graphics[{
  ColorData[97, 1], First@p1,
  ColorData[97, 2], First@p2
  }]

Output

If anybody knows of a better way to turn a convex hull mesh into a polygon, please let me know.

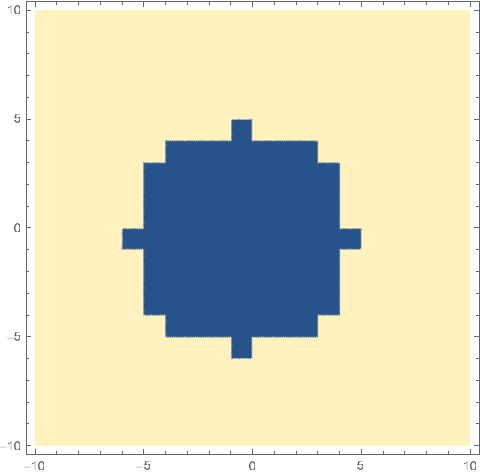
Interpolation

Interpolation with interpolation order 0.

data = Join[{#, 1} & /@ in, {#, 2} & /@ out];
interp = Interpolation[data, InterpolationOrder -> 0];

DensityPlot[
 interp[x, y],
 {x, -10, 10},
 {y, -10, 10},
 PlotPoints -> 100
 ]

Output

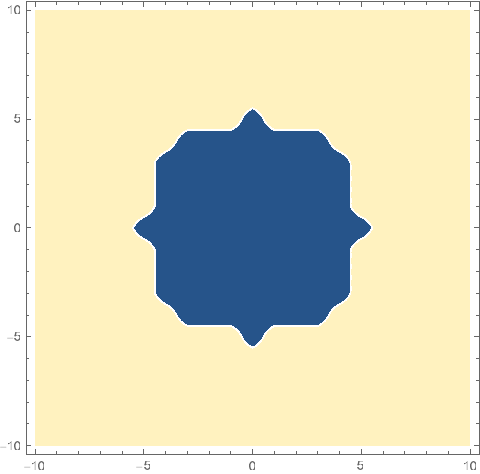
Using a higher interpolation order and rounding to get smoothed boundaries:

interp = Interpolation[data, InterpolationOrder -> 1];
DensityPlot[
 Round@interp[x, y],
 {x, -10, 10},
 {y, -10, 10},
 PlotPoints -> 100
 ]

Output

$\endgroup$
5
  • $\begingroup$ Concerning ConvexHullMesh: I think MeshPrimitives[mesh, 2] yields a list of the 2-D polygons in the mesh. $\endgroup$ Commented Aug 13, 2020 at 15:26
  • $\begingroup$ Thanks for your response! Would the mesh still work as well if I had multiple disconnected regions? $\endgroup$
    – Cheyne
    Commented Aug 13, 2020 at 16:01
  • $\begingroup$ Interpolation seemed to work well for my data! $\endgroup$
    – Cheyne
    Commented Aug 13, 2020 at 17:53
  • $\begingroup$ That's it, thanks @MichaelSeifert, $\endgroup$
    – C. E.
    Commented Aug 13, 2020 at 18:02
  • $\begingroup$ @Cheyne ok, good! I haven't looked into how ConvexHullMesh treats disconnected regions. $\endgroup$
    – C. E.
    Commented Aug 13, 2020 at 18:06
5
$\begingroup$

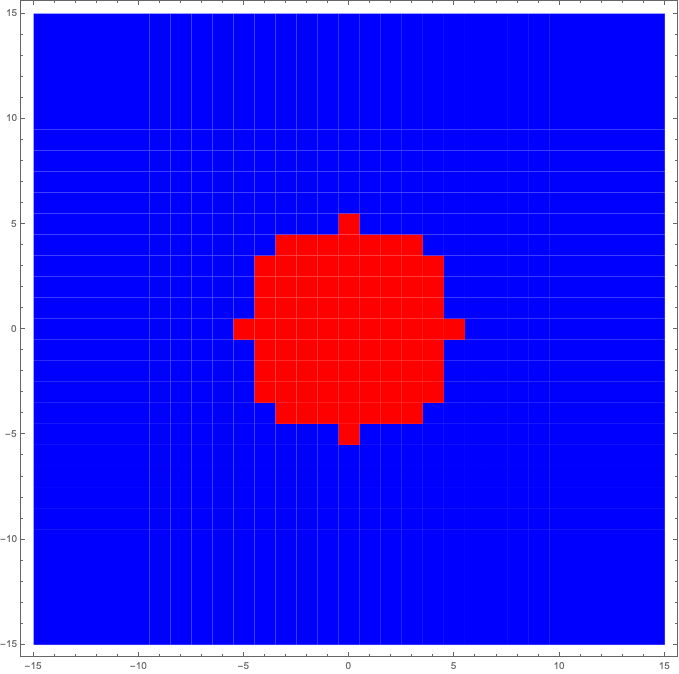
VoronoiMesh method

points = Drop[data, None, -1];
mesh = VoronoiMesh[points];
polygons = MeshPrimitives[mesh, 2];
coloredpolygons = Map[{incircle @@ RegionCentroid[#], #} &, polygons];
Graphics[coloredpolygons]

enter image description here

VoronoiMesh automatically chooses the coordinates of the boundaries of the mesh, but you can also specify the boundaries via a second argument (VoronoiMesh[points, {{xmin, xmax}, {ymin, ymax}}]) if you want.

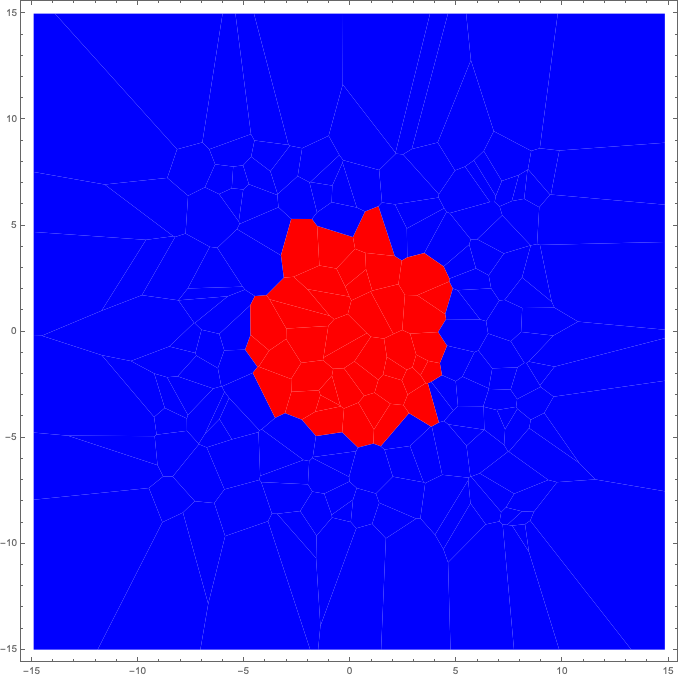
This method generalizes nicely to irregularly located points as well.

points = RandomReal[{-10, 10}, {200, 2}];
(* Remaining code as above *)

enter image description here

Note, however, that there is a bug in this code: the centroid of a Voronoi cell is not necessarily its "base point". This may make a difference in some cases, particularly if your base points are not uniformly distributed.

I will have to think if there's an easy way to color the Voronoi cells based on their base point, rather than their centroid. Complicating matters is that MeshPrimitives[VoronoiMesh[points]] appears to shuffle the order of the resulting polygons (i.e., the $i$th polygon in the result does not necessarily contain the $i$th element of points.)

$\endgroup$
0
$\begingroup$

This looks a bit cleaner, and it does what you want:

pdat1=List/@data[[All,;;2]];
pcol1=List/@data[[All,3]];
ListPlot[pdat1, PlotStyle -> pcol1, PlotMarkers -> "\[FilledSquare]", ImageSize -> {250, 250}]

Same as original output from OP.

This uses VertexColors, but is in Graphics using Point:

Graphics[{PointSize[Medium],Point[data[[All,;;2]],VertexColors->data[[All,3]]]}, ImageSize -> {250, 250},Axes->True]

Image output of above code

I’ll add other methods once I am back to a PC.

$\endgroup$
7
  • 1
    $\begingroup$ This looks the same as OP's image for me. What is the difference? $\endgroup$
    – C. E.
    Commented Aug 13, 2020 at 7:53
  • $\begingroup$ @C.E. the syntax looks cleaner and may be easier to understand. From what I gather, the OP is looking for a better syntax to color each point, while still keeping them points. $\endgroup$ Commented Aug 13, 2020 at 7:59
  • $\begingroup$ To the down-voter, what is the issue with this answer? Seemingly this is exactly what the OP is asking for. $\endgroup$ Commented Aug 13, 2020 at 8:14
  • 2
    $\begingroup$ I'm not the downvoter, but I think that OP may be looking for something like what I posted in my answer. But let's wait and see. $\endgroup$
    – C. E.
    Commented Aug 13, 2020 at 8:19
  • 1
    $\begingroup$ @C.E. Ah this could be true. If that’s the case, I would update my answer. :) $\endgroup$ Commented Aug 13, 2020 at 8:22

Your Answer

By clicking “Post Your Answer”, you agree to our terms of service and acknowledge you have read our privacy policy.

Not the answer you're looking for? Browse other questions tagged or ask your own question.