9
$\begingroup$

I implemented the Bezier curve like built-in BezierCurve as follow:

SplineDegree -> d specifies that the underlying polynomial basis should have maximal degree d.

Method is a option that determining which algorithm was used.

ControlPoints is a option that determining whether show the control points

SplineClosed is an option that specifies whether spline curves or surfaces should be closed.

CAGDBezierCurve by default represents a composite cubic Bézier curve.

With SplineDegree -> d, CAGDBezierCurve with d + 1 control points yields a simple degree - d Bézier curve.With fewer control points, a lower - degree curve is generated. With more control points, a composite Bézier curve is generated.


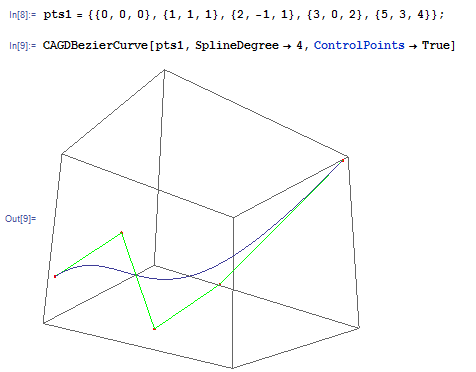
UPDATE for 3D CASE

Options[CAGDBezierCurve] = {SplineClosed -> False, 
 SplineDegree -> Automatic, ControlPoints -> False, Method -> Automatic};

CAGDBezierCurve[pts : {{_, _} ..} | {{_, _, _} ..}, opts : OptionsPattern[]] :=
 Module[{sc, sd, cp, Bezier, ptgroup},
  sc = OptionValue[SplineClosed];
  sd = OptionValue[SplineDegree] /. Automatic -> 3;
  cp = OptionValue[ControlPoints];
  Bezier =
   ToExpression@OptionValue[Method] /. Automatic -> BezierDefinition;
  ptgroup = Partition[pts, sd + 1, sd, 1, {}];
  If[Length@First@pts == 2,
   ParametricPlot[
    Evaluate[Bezier[#, u] & /@ ptgroup], {u, 0, 1},
    Evaluate@
     (Sequence @@
       FilterRules[{opts}, Options[ParametricPlot]]), 
      Axes -> False, PlotRange -> All,
    Epilog -> If[cp, {Green, Line[pts], Red, Point[pts]}, {}]],
   Show[
    {ParametricPlot3D[
      Evaluate[Bezier[#, u] & /@ ptgroup], {u, 0, 1},
      Evaluate@
       (Sequence @@FilterRules[{opts}, Options[ParametricPlot3D]]), 
      Axes -> False, PlotRange -> All],
    Graphics3D[
     If[cp, {Green, Line[pts], Red, Point[pts]}]]}]
  ]
]

BezierDefinition[pts_, u0_?NumericQ] :=
 Nest[
  MovingAverage[
   ArrayPad[#, 1], {u0, 1 - u0}] &, {1}, Length[pts] - 1].pts

deCasteljau[pts_, u0_?NumericQ] :=
 Nest[
  MovingAverage[#, {1 - u0, u0}] &, pts, Length@pts - 1]

Owning to the HoldAll attribute of ParametricPlot, so I must used the Evaluate three times in the ParametricPlot.

In addition, I know the ParametricPlot owns the Evaluated-> True option, so I refactor(remove Evaluate) the part of ParametricPlot as below:

ParametricPlot[
 Bezier[#, u] & /@ ptGroup, {u, 0, 1},
 Evaluated -> True,
 Sequence @@
  FilterRules[{opts}, Options[ParametricPlot]],
 Axes -> False, PlotRange -> All, 
 Epilog -> If[cp, {Green, Line[pts], Red, Point[pts]}, {}]
]

However, it failed.

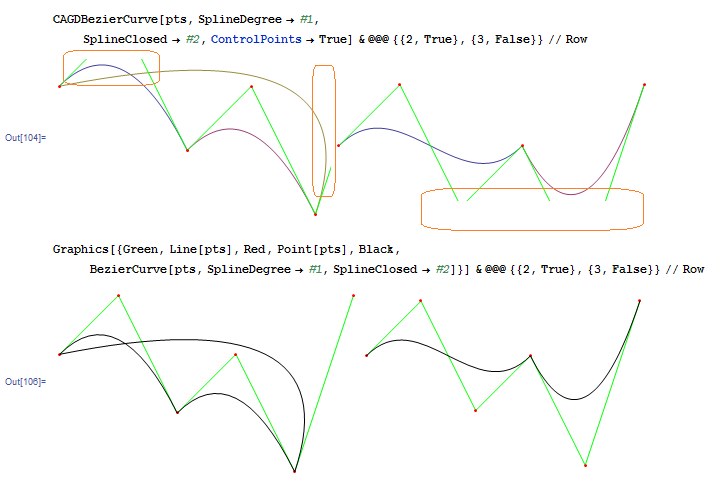
TEST

pts = {{0, 0}, {1, 1}, {2, -1}, {3, 0}, {4, -2}, {5, 1}};

CAGDBezierCurve[pts, SplineDegree -> #1, SplineClosed -> #2, 
 ControlPoints -> True] & @@@ {{2, True}, {3, False}} // Row

Graphics[{Green, Line[pts], Red, Point[pts], Black, 
 BezierCurve[pts, SplineDegree -> #1, 
  SplineClosed -> #2]}] & @@@ {{2, True}, {3, False}} // Row
enter image description here

pts1 = {{0, 0, 0}, {1, 1, 1}, {2, -1, 1}, {3, 0, 2}, {5, 3, 4}};

CAGDBezierCurve[pts1, SplineDegree -> 4, ControlPoints -> True]
enter image description here


QUESTION

  • Is there a solution to deal with avoiding using Evaluate function many times?

  • Why the PlotRange -> All cannot show the entire graph?

$\endgroup$
2
  • 1
    $\begingroup$ I sometimes use ParametricPlot @@ {args...}, or Block[{u}, ParametricPlot @@ {args...}], to get around Evaluated. $\endgroup$
    – Michael E2
    Commented Aug 19, 2015 at 9:49
  • $\begingroup$ @MichaelE2, I see. By the ParametricPlot @@ {args...}, the args would be evalauted firstly.THX:) $\endgroup$
    – xyz
    Commented Aug 19, 2015 at 10:45

1 Answer 1

10
$\begingroup$

I have reworked your code somewhat. I hope what I have done will help you with your problem.

BezierDefinition[pts_, u0_?NumericQ] := 
  Nest[MovingAverage[ArrayPad[#, 1], {u0, 1 - u0}] &, {1}, Length[pts] - 1].pts

ClearAll @ CAGDBezierCurve;
Options[CAGDBezierCurve] = 
  {SplineClosed -> False, SplineDegree -> Automatic, 
   ControlPoints -> False, Method -> Automatic};
CAGDBezierCurve[
     pts : {{_, _} ..}, 
     opts : OptionsPattern[{CAGDBezierCurve, ParametricPlot}]] := 
   Module[{sc, sd, cp, Bezier, ptGroup},
   sc = OptionValue[SplineClosed];
   sd = OptionValue[SplineDegree] /. Automatic -> 3;
   cp = OptionValue[ControlPoints];
   Bezier = 
    ToExpression @ OptionValue[Method] /. Automatic -> BezierDefinition;
   ptGroup = 
     If[sc, 
        Partition[Append[pts, First@pts], sd + 1, sd, 1, {}], 
        Partition[pts, sd + 1, sd, 1,
        {}]];
   ParametricPlot[Bezier[#, u] & /@ ptGroup, {u, 0, 1}, 
     Evaluate @ FilterRules[{opts}, Options[ParametricPlot]],
     Axes -> False, PlotRange -> All, 
     Epilog -> If[cp, {Green, Line[pts], Red, Point[pts]}, {}]]]

CAGDBezierCurve[pts,
  SplineDegree -> #1, SplineClosed -> #2, ControlPoints -> True, 
  ImageSize -> Medium, PlotRange -> {{0., 5.}, {-2., 1.}}, 
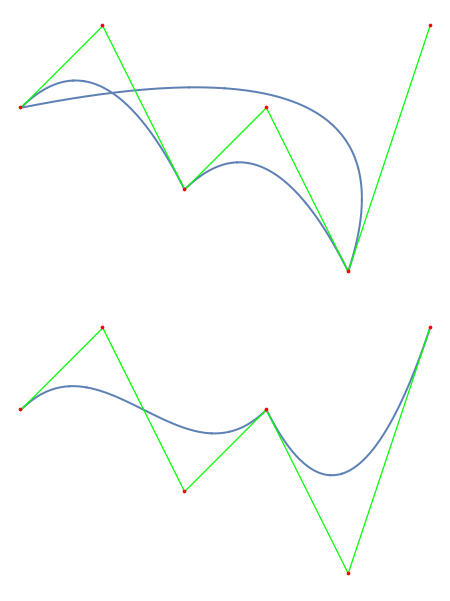
  PlotRangePadding -> {.25, .3}] & @@@ {{2, True}, {3, False}} // Column

curves

Discussion

  1. I have reduced the number of Evaluates to one; the others were simply not necessary, at least in V10.2. Over the last several releases Mathematica's plotting functions have become much smarter about evaluating held arguments internally.

  2. I have corrected mistakes made in handling options. The documentation on option handling is a disgrace, so don't feel bad about not getting it right.

  3. I have removed your alternative pattern for 3D points; there is no way your function as currently written can handle such points.

  4. I have not done anything about the clipping of Epilog graphics. The example output shown above demonstrates the missing graphics can be revealed by explicitly giving the plot range and increasing the plot range padding. This is a work-around, not a solution. Unfortunately, PlotRange -> All does not look at the epilog graphics when computing the plot range.

I know of no easy fix for the plot range problem. You might try to compute the needed space in your function and set the plot range explicitly.

Update

ShutaoTang has posted an answer with incorporates the points made above and also extends his CAGDBezierCurve function to handle 3D control points. I believe I can improve on his code a little by consolidating the two calls to Show into a single call simply by recognizing that the heads of expressions can be variables that get evaluated in the same way arguments do.

ClearAll@CAGDBezierCurve;
Options[CAGDBezierCurve] = 
  {SplineClosed -> False, SplineDegree -> Automatic, ControlPoints -> False, 
   Method -> Automatic};
CAGDBezierCurve[
    pts : {{_, _} ..} | {{_, _, _} ..}, 
    opts : OptionsPattern[{CAGDBezierCurve, ParametricPlot, ParametricPlot3D}]] :=
  Module[{sc, sd, cp, Bezier, ptgroup},
    sc = OptionValue[SplineClosed];
    sd = OptionValue[SplineDegree] /. Automatic -> 3;
    cp = OptionValue[ControlPoints];
    Bezier = 
      ToExpression @ OptionValue[Method] /. Automatic -> BezierDefinition;
    ptgroup = 
      If[sc, 
        Partition[Append[pts, First@pts], sd + 1, sd, 1, {}], 
        Partition[pts, sd + 1, sd, 1, {}]];
     Block[{u, plotF, graphF},
       With[{curves = Bezier[#, u] & /@ ptgroup},
         {plotF, graphF} =
           If[Length @ First @ pts == 2,
             {ParametricPlot, Graphics}, 
             {ParametricPlot3D, Graphics3D}];
         Show[{
           plotF[curves, {u, 0, 1},
             Evaluate@FilterRules[{opts}, Options[plotF]], Axes -> False, 
             PlotRange -> All], 
           graphF[If[cp, {Green, Line[pts], Red, Point[pts]}]]}]]]]
$\endgroup$
5
  • $\begingroup$ @MichaelE2. I tried that, but it did not show the full extent of the epilog graphics. $\endgroup$
    – m_goldberg
    Commented Aug 19, 2015 at 10:17
  • $\begingroup$ My mistake. I guess Show[ParametricPlot[...], Graphics[epilog stuff], PlotRange -> All] is how CAGDBezierCurve should be written. $\endgroup$
    – Michael E2
    Commented Aug 19, 2015 at 10:24
  • $\begingroup$ THX a lot for conrecting the option mistake opts : OptionsPattern[{CAGDBezierCurve, ParametricPlot}]. Now for the clipping of Epilog graphics, I have a idea that ultilizing the Graphics[{...}] and Show. $\endgroup$
    – xyz
    Commented Aug 19, 2015 at 10:58
  • $\begingroup$ BTW, I would know why the code Evaluate @Sequence @@ FilterRules[{opts}, Options[ParametricPlot]] could be replaced with Evaluate @ FilterRules[{opts}, Options[ParametricPlot]] $\endgroup$
    – xyz
    Commented Aug 19, 2015 at 11:05
  • $\begingroup$ @ShutaoTang. Options may be nested in lists any to any depth. The list structure is flattened by the internal graphics code. $\endgroup$
    – m_goldberg
    Commented Aug 19, 2015 at 15:58

Your Answer

By clicking “Post Your Answer”, you agree to our terms of service and acknowledge you have read our privacy policy.

Not the answer you're looking for? Browse other questions tagged or ask your own question.