Today,I use the Mathematica to deal with data.My code as below:
Needs["PlotLegends`"]
Function Definition:
 TargetList[dData_List, massData_List] := Block[
 {TargetListResult, dAverageData, miData},
 dAverageData = Mean /@ Partition[dData, 2, 1];
 miData = Table[Total@massData[[1 ;; i]], {i, 1, Length@dAverageData}];
 TargetListResult =
  MapThread[List,
            N@Log[10, #] & /@ {dAverageData/Max@dAverageData, miData/
    Total@massData}]
 ]
Data Input:
DryData={{8.28, 17.57, 10.15, 4.85, 2.41, 11.74}, {7.82, 12.19, 6.65, 3.57, 1.8, 20.97},
       {23.58, 19.44, 18.08, 11.1, 8.72, 19.08}, {25.18,16.51, 17.5, 8.01, 4.54, 28.26},
       {10.67, 28, 14.49, 17.86, 8.97, 20.01},{14.29, 19.28, 16.14, 15.54, 10.36,24.39},
       {25.94, 21.1,20.02, 11.37, 6.11, 15.46},{24.51, 23.99, 13.75, 11.95, 4.32,21.48},
       {33.51, 22.69, 19.26, 8.23, 4.88, 11.43},{22.15, 25.54, 23.5, 8.34, 4.69,15.78},
       {20, 19.06, 18.65, 12.19, 11.68,18.42}, {18.84, 20.09, 9.75, 15.3, 12.48,23.54}};

 DryNameData={"Space0-20,Dry", "Space20-40,Dry", "Tao0-20,Dry", "Tao20-40,Dry",
              "Yang0-20,Dry", "Yang20-40,Dry", "Pu0-20,Dry", "Pu20-40,Dry",
              "Yangshu0-20,Dry", "Yangshu20-40,Dry",
             "MoxigeBai0-20,Dry", "MoxigeBai20-40,Dry"};

 dData = {0, 0.25, 0.5, 1, 2, 5, 10};

 solvingDryData = Reverse /@ DryData;

 fitLineDryFunction =
 Fit[#, {1, x}, x] & /@ (TargetList[dData, List[##]] & @@@solvingDryData);
Without PlotLegends:
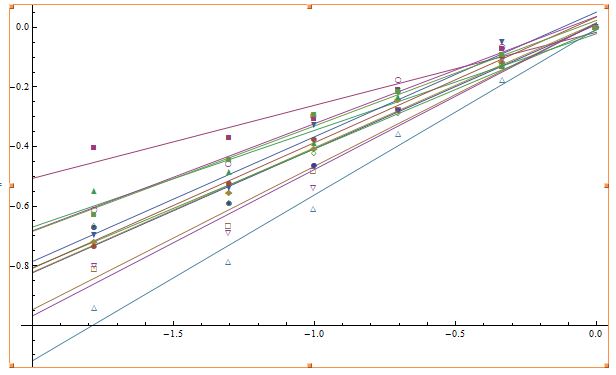
 Show[Plot[fitLineDryFunction, {x, -2, 0}, AxesOrigin -> {-2, -1},ImageSize -> 600],
   ListPlot[TargetList[dData, List[##]] & @@@ solvingDryData,
    AxesOrigin -> {-2, -1}, PlotMarkers -> Automatic, ImageSize -> 600]]
It give the normal graphics

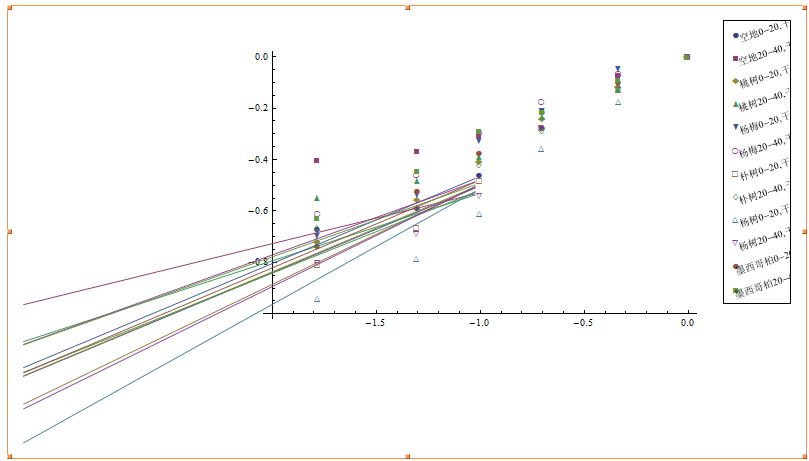
However,when I use the PlotLegendsoption,it gives the wrong result:
 Show[ListPlot[TargetList[dData, List[##]] & @@@ solvingDryData,
      AxesOrigin -> {-2, -1}, PlotLegend -> DryNameData,
      PlotMarkers -> Automatic, LegendPosition -> {1.1, -0.5},
      LegendSize -> 1.25, LegendShadow -> None,
      LegendTextOffset -> {-.6, 0}, LegendTextDirection -> {3, 1},
      ImageSize -> 800], Plot[fitLineDryFunction, {x, -2, 0}]]

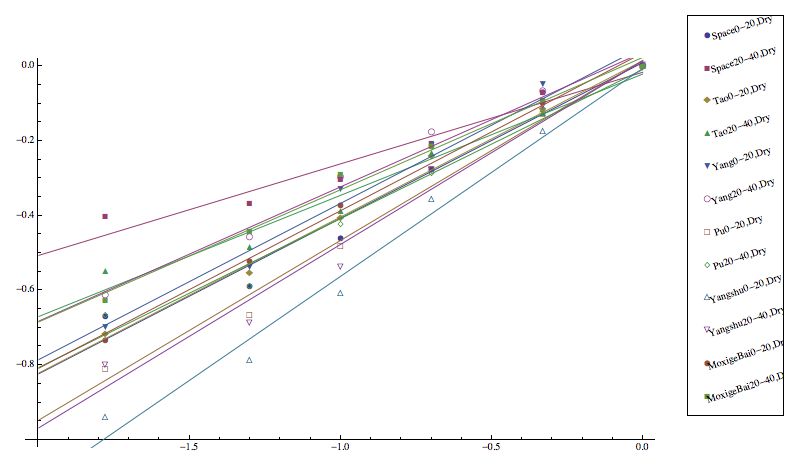
So my question is how to revise it?


LegendPositioninside theShow[]? I can't check at the minute, maybe look atEpilog? $\endgroup$