2
$\begingroup$

One can make graphs

GraphPlot[{1 -> 2, 2 -> 3, 3 -> 4, 4 -> 5, 5 -> 1, 1 -> 1, 5 -> 5}]

and one can generalize the input such that one labels edges

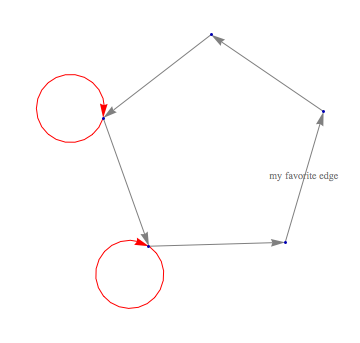
 GraphPlot[{1 -> 2, {2 -> 3, "my favorite edge"}, 3 -> 4, 4 -> 5,  5 -> 1, 1 -> 1, 5 -> 5}] 

Now in the Mathematica help for GraphPlot, under Options and then EdgeRenderingFunction one finds the example

GraphPlot[{1 -> 2, 2 -> 3, 3 -> 4, 4 -> 5, 5 -> 1, 1 -> 1, 5 -> 5}, 
EdgeRenderingFunction -> (If [
 First[#2] == Last[#2], {Red, Arrow[#1]}, {GrayLevel[0.5], 
  Arrow[#1]}] &)]

I want to use this to change the color of edges according to their naming, i.e. if the edge says "my favorite edge", then that edge should be green.

Problem is that once I use EdgeRenderingFunction,

GraphPlot[{1 -> 2, {2 -> 3, "my favorite edge"}, 3 -> 4, 4 -> 5, 5 -> 1, 1 -> 1, 5 -> 5}, 
EdgeRenderingFunction -> (If [
 First[#2] == Last[#2], {Red, Arrow[#1]}, {GrayLevel[0.5], 
  Arrow[#1]}] &)]

the data beyond "2 -> 3" gets ignored. How to solve this problem?

(I don't really have to use EdgeRenderingFunction to change the color, I just want more than just the names to point out some special edges.)

$\endgroup$

2 Answers 2

3
$\begingroup$

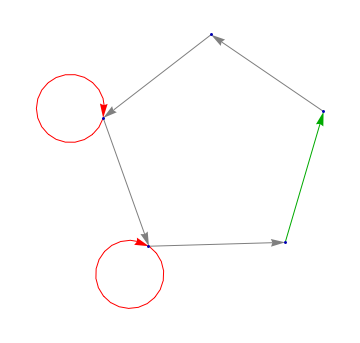
They're not ignored — the edge label is given as the third argument to EdgeRenderingFunction. You can do something like the following:

color := If[# === "my favorite edge", Darker@Green, GrayLevel[0.5]] &
GraphPlot[{1 -> 2, {2 -> 3, "my favorite edge"}, 3 -> 4, 4 -> 5, 5 -> 1, 1 -> 1, 5 -> 5}, 
    EdgeRenderingFunction -> (If[First[#2] == Last[#2], {Red, Arrow[#1]}, {color[#3], Arrow[#1]}] &)]

enter image description here

It might have seemed that it was being ignored because the labels were not displayed. The reason for this is given in "Possible issues" under EdgeLabeling:

An explicit setting for EdgeRenderingFunction overrides the setting for EdgeLabeling

So in order to get the edge labels, you'll have to incorporate that also in your EdgeRenderingFunction. Here's an example:

label := If[#1 =!= None, Text[#1, #2]] &
GraphPlot[{1 -> 2, {2 -> 3, "my favorite edge"}, 3 -> 4, 4 -> 5, 5 -> 1, 1 -> 1, 5 -> 5}, 
    EdgeRenderingFunction -> (If[First[#2] == Last[#2], {Red, Arrow[#1]}, {GrayLevel[0.5], 
        Arrow[#1], label[#3, Mean@#1]}] &)]

enter image description here

$\endgroup$
1
  • $\begingroup$ Thanks. I really wanted both at the same time, here is what I end up with: EdgeRenderingFunction -> (If[#3 == "my favorite edge", {Green, Arrow[#1], Text[Style[#3, Small, Black], Mean[#1]]}, {Gray, Arrow[#1]}] &). $\endgroup$
    – Nikolaj-K
    Commented Jul 14, 2012 at 17:27
0
$\begingroup$

Perhaps:

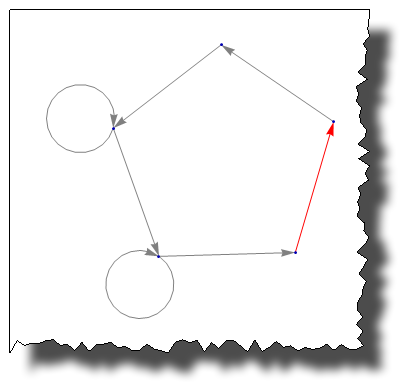
GraphPlot[{1 -> 2, {2 -> 3, "my favorite edge"}, 3 -> 4, 4 -> 5, 5 -> 1, 1 -> 1, 5 -> 5}, 
 EdgeRenderingFunction -> 
  Function[{x, y,  z}, (If[z == "my favorite edge", {Red, Arrow[x]}, , 
                                                    {GrayLevel[0.5], Arrow[x]}])]]

enter image description here

torn[] credit

$\endgroup$

Your Answer

By clicking “Post Your Answer”, you agree to our terms of service and acknowledge you have read our privacy policy.

Not the answer you're looking for? Browse other questions tagged or ask your own question.