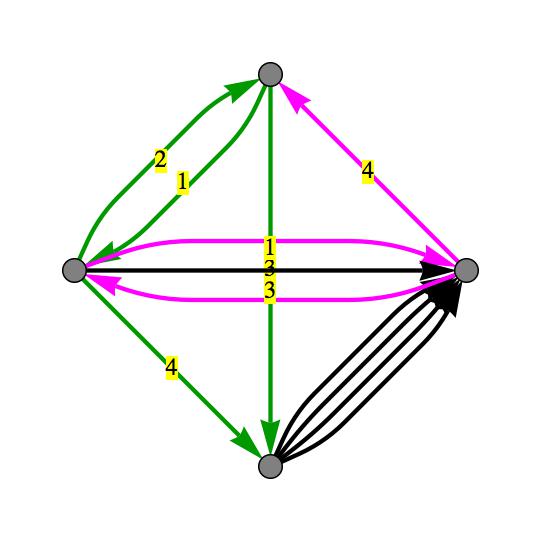
Bug introduced in 9.0 and fixed in 10.0.0
(Edit 1 : I added this paragraph after the original post, for context)
Some context for this question can be found in another post (https://mathematica.stackexchange.com/questions/30478/problem-with-edgerenderingfunction), which however may be taken off-line because the main problem there turned out to be a rather simple syntax error. In any case, the point is that I am trying to stretch GraphPlot beyond how it is normally used. I need 2 things: (1) different colour edges; and (2) labels on the edges, which in my case indicate the edge multiplicity for that colour. I was able to get this to work for graphs in which there is no more than a single directed edge -- in a given direction -- between two nodes. So, two labelled directed edges in opposite directions between the same 2 nodes works, but two labelled directed edges in the same direction between the same 2 nodes does not currently work. The approach I am using is to build 2-character labels that act as the 3rd argument of the EdgeRenderingFunction option of GraphPlot, such that the first character is the multiplicity of a given edge (and is used as an actual label) whereas the second character is used to specify the colour of the edge.
(Original post starts below)
I need to be able to draw multiple edges between the same nodes, and in different colours. Whereas this is easily done without labels, if I want each edge also to carry a label then I get an error. First define a graph:
test = {{1 -> 2, "11"}, {2 -> 1, "21"}, {1 -> 3, "31"}, {2 -> 3, "41"},
{2 -> 4, "12"}, {2 -> 4, "21"}, {4 -> 2, "32"}, {4 -> 1, "42"}, 3 -> 4,
3 -> 4, 3 -> 4, 3 -> 4};
I can have as many '3 -> 4' as I want and as many edges will be drawn between Nodes 3 and 4. But the two edges I am trying to draw between Nodes 2 and 4 give an error.
The Mathematica documentation has an example where this works. It's in the GraphPlot documentation, under Applications/Finite State Diagrams, so I am puzzled that it does not work here. Note that if I get rid of the second 2 -> 4 rule, i.e. {2 -> 4, "21"}, then this code works fine:
circleLayout[n_] := Table[u -> {Cos[2 Pi/n u], Sin[2 Pi/n u]}, {u, 1, n}];

GraphPlot[test,
  MultiedgeStyle -> 0.15,
  VertexCoordinateRules -> circleLayout[4],
  SelfLoopStyle -> .2,
  VertexRenderingFunction -> ({Gray, EdgeForm[Black], Disk[#, .06]} &),
  EdgeRenderingFunction ->
    (If[Intersection[{None}, {#3}] != {},
           {RGBColor[0, 0, 0], Thickness[.008], Arrowheads[.07], Arrow[#1, 0.05]},
      Switch[Characters[#3][[2]],
        "1", {RGBColor[0, 0.6, 0], Thickness[.008], Arrowheads[.07], Arrow[#1, 0.05],
              Inset[Style[Characters[#3][[1]], Black, FontSize -> 16],
                    Mean[#1], {0, 0}, Background -> Yellow]},
        "2", {RGBColor[1, 0, 1], Thickness[.008], Arrowheads[.07], Arrow[#1, 0.05],
              Inset[Style[Characters[#3][[1]], Black, FontSize -> 16],
                    Mean[#1], {0, 0}, Background -> Yellow]}
            ]
        ]
    &),
   PlotStyle -> Thickness[.007],
   PlotRange -> {{-1.1, 1.1}, {-1.1, 1.1}}
 ]
The error I get is this:
Part 2 of Characters[Network`GraphPlot`wrapper["12"]] does not exist
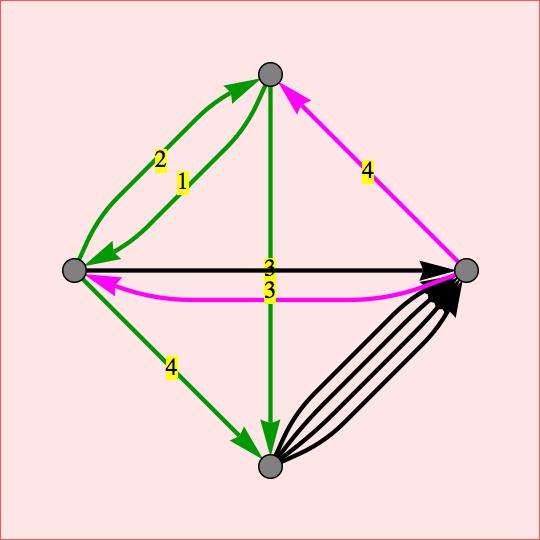
I paste a jpeg of the output. The nodes are numbered 1-4 counterclockwise from the top. This picture is close to what it is supposed to look like. The only wrong arrow is the black horizontal arrow from Node 2 to Node 4. In place of that there should be two arrows, one green and the other magenta, in the same direction from 2 to 4 and with different labels.

I have shortened the InputForm for the graphical output of the above command (I deleted the intermediate coordinates of all the Arrows) so I could paste it below. I also added blank lines between the instructions for different arrows to make the output easier to interpret.
Graphics[Annotation[{{Thickness[0.007], {RGBColor[0, 0.6, 0],
 Thickness[0.008], Arrowheads[0.07], Arrow[{{0., 1.},
  {-0.06647942640193483, 0.8537452619157436},
   ...
  {-0.8537452619157443, 0.0664794264019346}, {-1., 0.}}, 0.05],
 Inset[Style["1", GrayLevel[0], FontSize -> 16],
  {-0.44451835279238505, 0.4445183527923848}, {0, 0},
  Background -> RGBColor[1, 1, 0]]},

{RGBColor[0, 0.6, 0],
 Thickness[0.008], Arrowheads[0.07], Arrow[{{0., 1.}, {0.,
  -1.}}, 0.05], Inset[Style["3", GrayLevel[0],
   FontSize -> 16], {0., 0.}, {0, 0}, Background ->
   RGBColor[1, 1, 0]]},

{RGBColor[0, 0.6, 0],
 Thickness[0.008], Arrowheads[0.07], Arrow[{{-1., 0.},
  {-0.9335205735980654, 0.14625473808425649},
   ...
  {-0.14625473808425588, 0.9335205735980656}, {0., 1.}}, 0.05],
 Inset[Style["2", GrayLevel[0], FontSize -> 16],
  {-0.5554816472076151, 0.5554816472076154}, {0, 0},
  Background -> RGBColor[1, 1, 0]]},

{RGBColor[0, 0.6, 0],
 Thickness[0.008], Arrowheads[0.07], Arrow[{{-1., 0.}, {0.,
  -1.}}, 0.05], Inset[Style["4", GrayLevel[0],
   FontSize -> 16], {-0.5, -0.5}, {0, 0},
  Background -> RGBColor[1, 1, 0]]},

Switch[Characters[Network`GraphPlot`wrapper["12"]][[2]],
 "1", {RGBColor[0, 0.6, 0], Thickness[0.008],
  Arrowheads[0.07], Arrow[{{-1., 0.}, {-0.7872658355138089,
   0.07977531168232177},
   ...
    {0.7872658355138097, 0.07977531168232133}, {1., 0.}}, 0.05],
  Inset[Style[Characters[Network`GraphPlot`wrapper["12"]][[
     1]], Black, FontSize -> 16], Mean[{{-1., 0.},
    {-0.7872658355138089, 0.07977531168232177},
     ...
    {0.7872658355138097, 0.07977531168232133}, {1., 0.}}],
   {0, 0}, Background -> Yellow]},
 "2", {RGBColor[1, 0, 1], Thickness[0.008], Arrowheads[0.07],
  Arrow[{{-1., 0.}, {-0.7872658355138089,
   0.07977531168232177},
   ...
   {0.7872658355138097, 0.07977531168232133}, {1., 0.}}, 0.05],
  Inset[Style[Characters[Network`GraphPlot`wrapper["12"]][[
     1]], Black, FontSize -> 16], Mean[{{-1., 0.},
    {-0.7872658355138089, 0.07977531168232177},
     ...
    {0.7872658355138097, 0.07977531168232133}, {1., 0.}}],
   {0, 0}, Background -> Yellow]}],

{RGBColor[0, 0, 0],
 Thickness[0.008], Arrowheads[0.07], Arrow[{{-1., 0.}, {1.,
  0.}}, 0.05]},

{RGBColor[0, 0, 0], Thickness[0.008],
 Arrowheads[0.07], Arrow[{{0., -1.}, {0.06647942640193483,
  -0.8537452619157436},
   ...
  {0.8537452619157443, -0.0664794264019346}, {1., 0.}},
  0.05]},

{RGBColor[0, 0, 0], Thickness[0.008],
 Arrowheads[0.07], Arrow[{{0., -1.}, {0.08817568578755441,
  -0.886631261130288},
  ...
   {0.8866312611302873, -0.08817568578755464}, {1., 0.}}, 0.05]},

{RGBColor[0, 0, 0], Thickness[0.008], Arrowheads[0.07],
 Arrow[{{0., -1.}, {0.11336873886971244,
  -0.9118243142124458},
   ...
   {0.9118243142124456, -0.1133687388697131}, {1., 0.}}, 0.05]},

{RGBColor[0, 0, 0], Thickness[0.008], Arrowheads[0.07],
 Arrow[{{0., -1.}, {0.14625473808425649,
  -0.9335205735980654},
  ...
  {0.9335205735980656, -0.14625473808425588}, {1., 0.}},
  0.05]},

{RGBColor[1, 0, 1], Thickness[0.008],
 Arrowheads[0.07], Arrow[{{1., 0.}, {0.7872658355138089,
  -0.07977531168232177},
  ...
   {-0.7872658355138097, -0.07977531168232133}, {-1., 0.}}, 0.05],
 Inset[Style["3", GrayLevel[0], FontSize -> 16],
  {-3.392348130799089*^-16, -0.11096329441523041}, {0, 0},
  Background -> RGBColor[1, 1, 0]]},

{RGBColor[1, 0, 1],
 Thickness[0.008], Arrowheads[0.07], Arrow[{{1., 0.}, {0.,
  1.}}, 0.05], Inset[Style["4", GrayLevel[0],
   FontSize -> 16], {0.5, 0.5}, {0, 0},
  Background -> RGBColor[1, 1, 0]]}},

 {Thickness[0.007], {GrayLevel[0.5], EdgeForm[GrayLevel[0]],
 Disk[{0., 1.}, 0.06]}, {GrayLevel[0.5],
 EdgeForm[GrayLevel[0]], Disk[{-1., 0.}, 0.06]},
 {GrayLevel[0.5], EdgeForm[GrayLevel[0]],
 Disk[{0., -1.}, 0.06]}, {GrayLevel[0.5],
 EdgeForm[GrayLevel[0]], Disk[{1., 0.}, 0.06]}}},
 VertexCoordinateRules -> {{0., 1.}, {-1., 0.}, {0., -1.}, {1.,
 0.}}], FrameTicks -> None, PlotRange ->
 {{-1.1, 1.1}, {-1.1, 1.1}}, PlotRangePadding -> Scaled[0.1],
 AspectRatio -> Automatic]
It looks like the presence of two {2 -> 4, "some label"} edges throws off the code above. The error refers to the first one of these, the second one does not appear at all in the InputForm output. In place of the arrow-related objects you can see the Switch structure.
I tried making the labels identical (as they are in the Mathematica documentation) and it did not make any difference.
Any suggestions? Thanks in advance.
EDIT 2 (after a few days):
I have made a small step forward but am still far from the actual solution. Consider this code:
Clear[test];
test = {{1 -> 2, "11"}, {2 -> 1, "21"}, {1 -> 3, "31"}, {2 -> 3, "41"}, {2 -> 4,"12"},
       {2 -> 4, "21"}, {4 -> 2, "32"}, {4 -> 1, "42"}, 3 -> 4, 3 -> 4, 3 -> 4, 3->4};

GraphPlot[test,
MultiedgeStyle -> All,
VertexCoordinateRules -> circleLayout[n],
SelfLoopStyle -> .2,
VertexRenderingFunction -> ({Gray, EdgeForm[Black], Disk[#, .06]} &),
EdgeRenderingFunction ->
(
If[Intersection[{None}, {Print[#3]; #3}] != {},
        {RGBColor[0, 0, 0], Thickness[.008], Arrowheads[.07], Arrow[#1, 0.05]},
        Switch[Characters[If[Depth[#3] > 1, #3[[1]], #3]][[2]],
         "1", {RGBColor[0, 0.6, 0], Thickness[.008], Arrowheads[.07], Arrow[#1, 0.05],
            Inset[Style[Characters[If[Depth[#3] > 1, #3[[1]], #3]][[1]],
            Black, FontSize -> 16], Mean[#1], {0, 0}, Background -> Yellow]},
         "2", {RGBColor[1, 0, 1], Thickness[.008], Arrowheads[.07], Arrow[#1, 0.05],
            Inset[Style[Characters[If[Depth[#3] > 1, #3[[1]], #3]][[1]],
            Black, FontSize -> 16], Mean[#1], {0, 0}, Background -> Yellow]}
              ]
       ]
    &),
PlotStyle -> Thickness[.007],
PlotRange -> {{-1.1, 1.1}, {-1.1, 1.1}}
]
By using Depth[] I was able to extract the label "12" from inside the "NetworkGraphplotwrapper[12]" thing (not sure what to call it). This is great but what worries me is that the label "21" corresponding to the second directed arrow 2 -> 4 has, as before, completely disappeared.
The graph looks like this now:

The black arrow from 2 to 4 came out black because the label "21" disappeared.
I found this rather arcane post
https://stackoverflow.com/questions/4091728/tips-for-creating-graph-diagrams
that talks about something vaguely related, i.e. "NetworkGraphPlotDumpRuleListGraphQ[x_]", but I don't know enough under-the-hood Mathematica to make much sense of it...
Edit 3: I spent a couple more days on this and could not find a workaround. Although using this as one of the edges almost works: {2 -> 4, {"12","21"}}. I can access the label I want with #3[1] or #3[2]. The problem of course that this is the spec for just one edge and not two as I need. So I don't think this can be a solution unless somebody knows of a way to force a second 2 -> 4 edge.
I would like to document that this is indeed a bug, apparently with V9. I paste here the GraphPlot command from one of the examples in the GraphPlot documentation (Examples/Applications/Finite State Diagrams):
GraphPlot[{"start" -> "empty", {"empty" -> "empty", "other"}, {"empty" -> "n", "n"},
 {"n" -> "n", "n"}, {"n" -> "empty", "other"}, {"n" -> "na", "a"},
 {"na" -> "nan", "n"}, {"na" -> "empty", "other"}, {"nan" -> "na", "a"},
 {"nan" -> "na", "a"}, {"nan" -> "nano", "o"}, {"nan" -> "empty", "other"},
 {"nano" -> "nano", "any"}}, VertexLabeling -> True, DirectedEdges -> True,
 MultiedgeStyle -> 0.3]
The graph that comes out of this has the same "NetworkGraphPlotwrapper[a]" string as the label of one of the "nan"->"na" edges, and none on the second "nan"->"na" edge. That's different from what the documentation shows, which is two "a" labels on two separate directed edges between the same two nodes, as we would expect.
How can we inform Wolfram? Any hope they will fix it once they know??
Thanks.

circleLayout? $\endgroup$circleLayout[n_] := Table[u -> {Cos[2 Pi/n u], Sin[2 Pi/n u]}, {u, 1, n}];$\endgroup$VertexCoordinates. (New in version 8.0 so you can't see it if you're still on v7...) $\endgroup$circleLayout[4]I get no errors in version 7, so this is apparently version specific. $\endgroup$