6
$\begingroup$

Introduced in version 9, fixed in version 10.

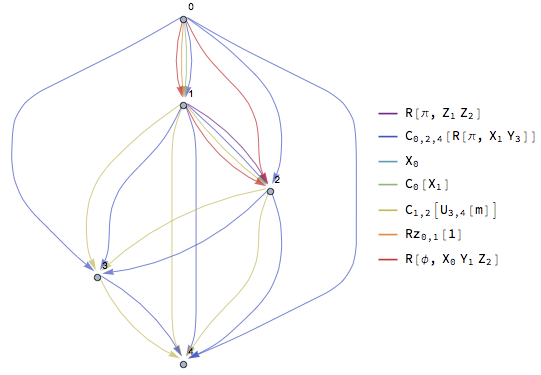
Thanks Szabolcs for providing this screenshot showing that the bug is fixed.


Despite the integration of graphs and networks, multigraphs are not supported in Mathematica 8+.

In Mathematica 9+, GraphPlot misbehaves for multigraphs having labelled parallel edges:

GraphPlot[{{1 -> 2, "a"}, {1 -> 2, "b"}, {2 -> 1, "c"}}]
GraphPlot[{{1 -> 2, "a"}, {1 -> 2, "b"}, {2 -> 1, "c"}}, DirectedEdges -> True]

GraphPlot multidigraph misbehavior

GraphPlot multigraph misbehavior

EdgeRenderingFunction is passed the nonsense labels, so using it is out of the question.

Due to this bug, it appears there is no easy way for Mathematica 9+ to render a multigraph with labels.

Are there any workarounds, or should I look somewhere other than Mathematica?

$\endgroup$
3
  • $\begingroup$ Related: mathematica.stackexchange.com/q/6282/5 $\endgroup$
    – rm -rf
    Commented Apr 1, 2014 at 6:07
  • 1
    $\begingroup$ This bug appears to obtain still in MMA 10; Try Graph[{Labeled[1 \[DirectedEdge] 2, "p"], Labeled[1 \[DirectedEdge] 2, "q"]}] for disappointing results. $\endgroup$
    – Reb.Cabin
    Commented Sep 7, 2014 at 15:20
  • $\begingroup$ Same problem in MMA V12.0. $\endgroup$ Commented Nov 21, 2019 at 16:38

2 Answers 2

8
$\begingroup$

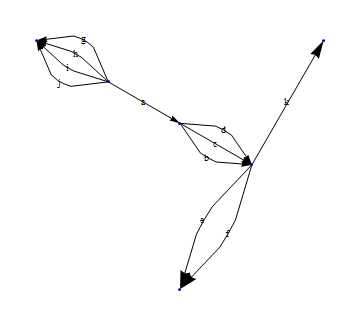
Here is a manual EdgeRenderingFunction that you can start from if you supply your labels as lists.

erf = Module[{spacing = .2, 
     transform = 
      Last@FindGeometricTransform[#, {{0, 0}, {1, 0}}]}, {Text[#, 
        transform[{1/2, #2}]], 
       GeometricTransformation[
        Arrow[BSplineCurve[{{0, 0}, {1/3, #2}, {2/3, #2}, {1, 0}}, 
          SplineWeights -> {1, 10, 10, 1}]], transform]} & @@@ 
     Thread[{#3, 
       Table[spacing*a, {a, Length@#3}] - 
        spacing*(Length@#3 + 1)/2}]] &;

GraphPlot[{{1 -> 2, {"a"}}, {2 -> 3, {"b", "c", "d"}}, {3 -> 4, {"e", 
    "f"}}, {1 -> 5, {"g", "h", "i", "j"}}, {3 -> 6, {"k"}}}, 
 EdgeRenderingFunction -> erf]
enter image description here

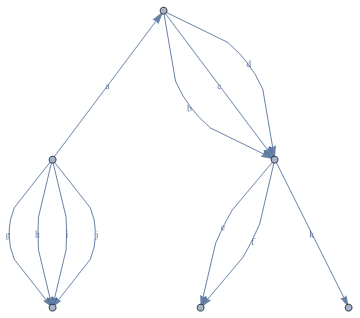
To do the same with Graph instead of GraphPlot requires a bit more work because EdgeShapeFunctions for Graphs aren't given the labels. So you need to Fold across the edges of the Graph and replace the EdgeLabels with a custom EdgeShapeFunction containing the labels for each edge.

g = Graph[{Property[1 -> 2, EdgeLabels -> {"a"}], 
    Property[2 -> 3, EdgeLabels -> {"b", "c", "d"}], 
    Property[3 -> 4, EdgeLabels -> {"e", "f"}], 
    Property[1 -> 5, EdgeLabels -> {"g", "h", "i", "j"}], 
    Property[3 -> 6, EdgeLabels -> {"k"}]}];

es[labels_] := 
 Module[{spacing = .2, 
    transform = 
     Last@FindGeometricTransform[#, {{0, 0}, {1, 0}}]}, {Text[#, 
       transform[{1/2, #2}]], 
      GeometricTransformation[
       Arrow[BSplineCurve[{{0, 0}, {1/3, #2}, {2/3, #2}, {1, 0}}, 
         SplineWeights -> {1, 10, 10, 1}]], transform]} & @@@ 
    Thread[{labels, 
      Table[spacing*a, {a, Length@labels}] - 
       spacing*(Length@labels + 1)/2}]] &

g // Fold[
   RemoveProperty[{SetProperty[{#, #2}, 
       EdgeShapeFunction -> 
        es@PropertyValue[{#, #2}, EdgeLabels]], #2}, EdgeLabels] &, #,
    EdgeList@#] &
enter image description here

$\endgroup$
1
  • $\begingroup$ Thank you! This worked well for me in Mathematica 12.0 (I can't believe this bug is not yet fixed by Wolfram.) To save someone else the time-- if the graph layout chosen by Mathematica doesn't lay out edges as straight lines, the above code will fail in FindGeometricTransform because the sizes of the lists don't match. You can fix this by changing FindGeometricTransform[#, {{0, 0}, {1, 0}}] to FindGeometricTransform[{First[#],Last[#]},{{0,0},{1,0}},TransformationClass->"Affine"]. It also helps to choose your initial graph layout so that edges aren't place on top of one another. $\endgroup$ Commented Sep 2, 2020 at 14:38
1
$\begingroup$

I cooked up a work-around for labelling multigraphs in v11.2 without resorting to GraphPlot or forcing styles. In essence, we label edges with a temporary label which identifies the edge, and after graphical rendering, substitute in unique labels.

plotMultigraph[edges_List, labels_Association] := Module[

    (* prepare indices of lists in labels *)
    {inds = <| Rule @@@ Transpose[{Keys[labels], ConstantArray[1, Length[labels]]}] |>},

    (* produce graph graphics, labeling edges with LABEL[edge] *)
    Show @ Graph[ Table[ Labeled[edge, LABEL[edge]], {edge, edges}] ] /.

        (* replace LABEL[edge] with a unique label based on edge occurence so far *)
        LABEL[edge_] :> labels[edge][[ inds[edge]++ ]]
]

This accepts a list of edges {1->2, 2->3, ...} and an association of the labels associated with each edge <| (1-2) -> {"a", "b"}, (2->3) -> ... |>.

For example

plotMultigraph[
    {1 -> 2, 1 -> 2, 2 -> 3, 3 -> 2, 2 -> 3, 1 -> 2}, 
    <|(1 -> 2) -> {"a", "b", "c"}, (2 -> 3) -> {"d", "e"}, (3 -> 2) -> {"f"}|>]

example multigraph

Since we're applying Replace to Graphics, it's not clear/gauranteed that the order of encountering LABEL[edge] is the same order as passed to plotMultigraph. Hence, the ordering within the sublists of labels may need changing in applications where the label order on repeated edges matters.

This trick works also for unique edge styles (replacing Labeled with Style). You can get some cool results!

example plot

$\endgroup$

Your Answer

By clicking “Post Your Answer”, you agree to our terms of service and acknowledge you have read our privacy policy.

Not the answer you're looking for? Browse other questions tagged or ask your own question.