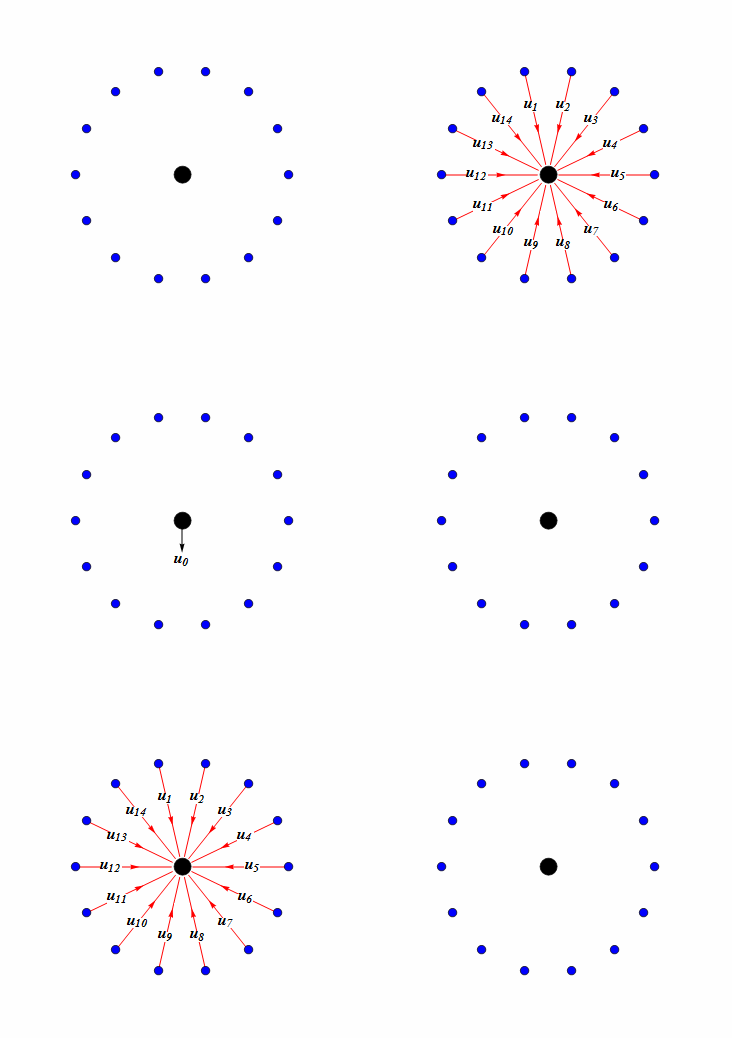
5
$\begingroup$

I am sorry that my attempt to obtain a fully functional plot as I want failed badly because I am not able to integrate the features to the graph.

Here is my simple code:

GraphPlot[{1 -> 11, 2 -> 11, 3 -> 11, 4 -> 11, 5 -> 11, 6 -> 11, 
7 -> 11, 8 -> 11, 9 -> 11, 10 -> 11}, DirectedEdges -> True, 
VertexLabeling -> True, PlotStyle -> Directive[PointSize[0.03], Red],
VertexRenderingFunction -> Function[{p, l}, {Blue, Point[p]}]]

What I want is as follows:

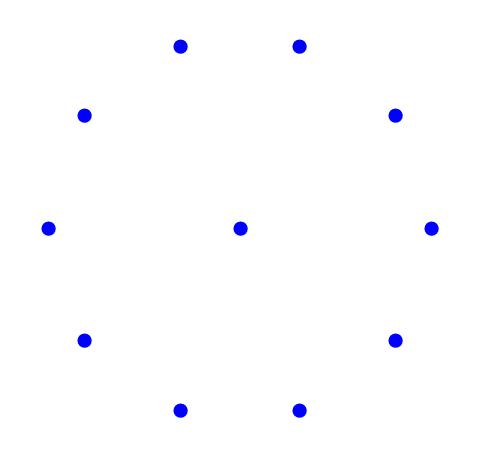
  1. First there are only the nodes (no edges) and the middle node is "black"

    GraphPlot[{1 -> 11, 2 -> 11, 3 -> 11, 4 -> 11, 5 -> 11, 6 -> 11, 
    7 -> 11, 8 -> 11, 9 -> 11, 10 -> 11}, DirectedEdges -> True, 
    VertexLabeling -> True, PlotStyle -> Directive[PointSize[0.03], Red],
    VertexRenderingFunction -> Function[{p, l}, {Blue, Point[p]}], 
    EdgeRenderingFunction -> None]
    

enter image description here

here I dont know how to change the color of only the middle node. The rest is okay.

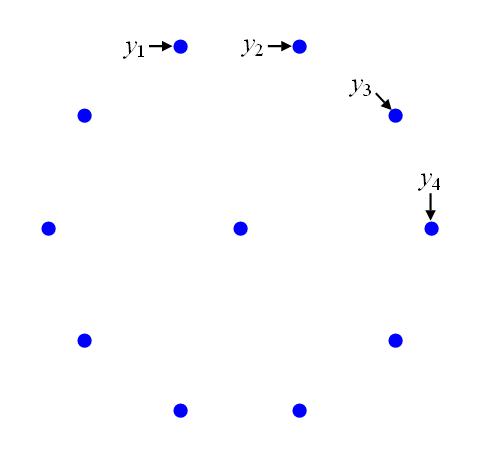
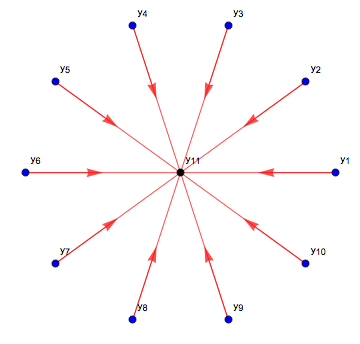
  1. Then all the nodes make an observation: it means the nodes will have labels marked with $y_i$, $i=1,...10$

I can do this only manually and here is an uncomplete example

enter image description here

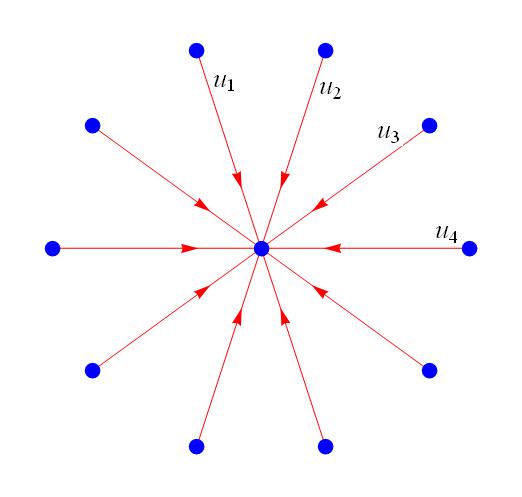
  1. Edges appear and and nodes transfer the decisions $u_i$, $i=1,...10$

    GraphPlot[{1 -> 11, 2 -> 11, 3 -> 11, 4 -> 11, 5 -> 11, 6 -> 11, 7 -> 11, 8 -> 11, 9 -> 11, 10 -> 11}, DirectedEdges -> True, VertexLabeling -> True, PlotStyle -> Directive[PointSize[0.03], Red], VertexRenderingFunction -> Function[{p, l}, {Blue, Point[p]}]]

enter image description here

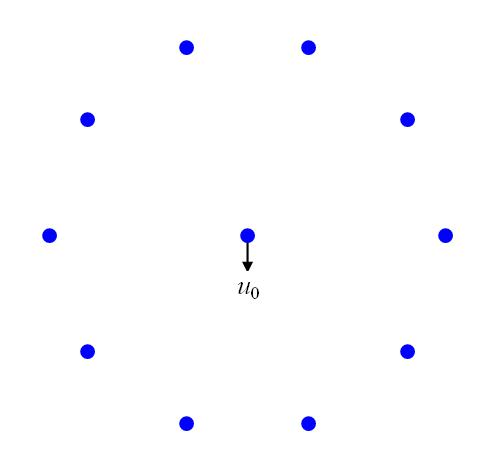
  1. All edges and $u_i$, $i=1,...10$ disappear and the middle node outputs $u_0$

Again I can do this manuallyenter image description here:

Is there a way to automate this process? Except for the color of the middle point (which I want it to be black), I can do the rest manually as well. However The figure sizes must be "the same" so that I can make a sort of short animation in a latex beamer presentation.

How can arrange the size of the plots in mathematica?

$\endgroup$
2
  • $\begingroup$ Re. a black point in the middle you can paint a black point by adding this to GraphPlot: Epilog -> { Black, PointSize[0.03], Point[{1, 0.95}] } $\endgroup$
    – C. E.
    Commented Oct 1, 2015 at 21:29
  • $\begingroup$ for the first question you can also use VertexRenderingFunction -> Function[{p, l}, {If[l == 11, Black, Blue], Point[p]}]. $\endgroup$
    – kglr
    Commented Feb 29, 2016 at 4:51

2 Answers 2

4
$\begingroup$
grF[n_Integer, t_, opts : OptionsPattern[Graph]] := 
 Module[{vcoords = Join[{Sin[#], Cos[#]} & /@ 
      Range[-\[Pi]/n, 2 (n - 1) \[Pi]/n, 2 \[Pi]/n], {{0, 0}}], 
   vertices = Join[Property[#, {VertexStyle -> Blue, VertexSize -> Medium}] & /@
       Range[n], {Property[n + 1, {VertexStyle -> Black, VertexSize -> Large}]}, 
     Property[Subscript[ToString@y, 
         ToString[# - n - 1]], {VertexShapeFunction -> None}] & /@ 
      Range[n + 2, 2 n + 1], {Property[Subscript[ToString@u, 
        ToString[0]], {VertexShapeFunction -> None}]}], 
   edges = Join[Property[# -> n + 1, 
               {EdgeShapeFunction -> ({Arrowheads[{{.03, 2/3}}], 
                 If[t == 2, Opacity@1, Opacity@0], Arrow[#, {0, .1}]} &), 
                EdgeLabels -> Placed[Style[Subscript["u", ToString[#]], Bold, 16, 
                  If[t == 2, Opacity@1, Opacity@0], Italic, 
                  Background -> White], {1/3, {1/2, 1/2}}], 
                EdgeStyle -> If[t == 2, Directive[Opacity[1], Red], 
                       Directive[Opacity[.0], Red]]}] & /@ Range[n], 
               Property[Subscript[ToString@y, ToString[# - n - 1]] -> # - n - 1, 
                 {EdgeShapeFunction -> ({Arrowheads[{{.03, 1.}}], 
                    If[t == 1, Opacity@1, Opacity@0], Arrow[#, {.1, .1}]} &),
                  EdgeLabels -> Placed[Style[Subscript["y", ToString[# - n - 1]], 
                     Bold, 16, If[t == 1, Opacity@1, Opacity@0], Italic], "Start"], 
                  EdgeStyle -> If[t == 1, Directive[Opacity[1], Black], 
                   Directive[Opacity[0], Black]]}] & /@ Range[n + 2, 2 n + 1], 
               {Property[ n + 1 -> Subscript[ToString@u, ToString[0]],
                {EdgeShapeFunction -> ({Arrowheads[{{.03, 1.}}], 
                   If[t >= 3, Opacity@1, Opacity@0], Arrow[#, {.0, .2}]} &), 
                 EdgeLabels -> Placed[Style[Subscript["u", ToString[0]], Bold, 16, 
                   Italic, If[t >= 3, Opacity@1, Opacity@0], 
                   Background -> White], {3/4, {1/2, 1/2}}], 
                 EdgeStyle -> If[t >= 3, Directive[Opacity[1], Black], 
                    Directive[Opacity[0], Black]]}]}]}, 
  Graph[vertices, edges, 
   VertexCoordinates -> Join[vcoords, 1.4 Most@vcoords, {{0, -.5} + Last@vcoords}], 
   ImagePadding -> 45, opts]]

 Dynamic@With[{t = Clock[{0, 4, 1}, 5, 2]}, grF[10, t, ImageSize -> 400]]

enter image description here

$\endgroup$
1
$\begingroup$
Graph[Join[
 Table[Labeled[i, Subscript["y", ToString[i]]], {i, 1, 10}], 
 {Labeled[Style[11, Black], Subscript["y", ToString[11]]]}],
 Table[Rule[i, 11], {i, 10}],
 DirectedEdges -> True, 
 VertexStyle -> Blue,
 EdgeStyle -> Red,
 EdgeShapeFunction -> ({Red, Line[#1], Arrowheads[{0, .05}], 
     Arrow[#1, {0, .5}]} &), 
 VertexCoordinates -> (Join[
    Table[{Cos[θ], Sin[θ]}, {θ, 0, 1.8 π, .2 π}], {{0., 0.}}])]

enter image description here

$\endgroup$

Your Answer

By clicking “Post Your Answer”, you agree to our terms of service and acknowledge you have read our privacy policy.

Not the answer you're looking for? Browse other questions tagged or ask your own question.