1
$\begingroup$

I'm fitting a linear model to some three dimensional data (x,y = explanatory variable, z = predicted variable). I am trying to visualize the data and model fit using a combination of 3D plots. Specifically, I want to plot the data in 3D plot and then have a 'fill' line down to a plane in 3D space that represents the model prediction. The problem I am having is figuring out the correct options for "Filling" in ListPointPlot3D to get the desired effect. I have tried 1->2, 1->{2}, {1->2}, and other variants but none of htem have the desired effect.

Here's an attempt to illustrate the problem.

xyzData = {{-0.31`, 0.222`, -0.025`}, {3.754`, -2.502`, 
    4.4`}, {0.658`, 1.301`, -3.481`}, {-0.377`, -1.869`, 
    13.746`}, {2.335`, -0.487`, 7.506`}, {0.618`, -2.151`, 
    7.045`}, {1.150`, 0.8250`, 0.148`}, {2.783`, -1.37`, 
    9.404`}, {0.774`, -2.823`, 7.264`}, {1.435`, -3.508`, 
    7.888`}, {3.64`, -2.308`, 11.922`}, {0.579`, -2.767`, 
    7.018`}, {1.754`, -2.317`, 11.3860`}, {1.791`, -4.276`, 
    7.58`}, {0.43`, -3.012`, 10.156`}, {1.406`, -2.485`, 
    6.463`}, {1.693`, -4.999`, 18.205`}, {1.618`, -2.394`, 
    11.532`}, {2.289`, -0.19`, 0.067`}, {-0.232`, -2.521`, 9.826`}};

(*get information on range of data values*)
{xData, yData, zData} = 
  Transpose[xyzData];
{xMin, xMax} = {Min[xData], Max[xData]};
{yMin, yMax} = {Min[yData], Max[yData]};
{zMin, zMax} = {Min[zData], Max[zData]};

(*fit linear model to the data*)

model =  LinearModelFit[xyzData, {x1, x2}, {x1, x2}];

(*create expected values based on linear fit *)

predictZ[x_, y_] = {x, y, model[x, y]};
predictedZ = Map[predictZ[#[[1]], #[[2]] ] &, xyData];

plot3d = Show[
   (*plot observed values and predicted values based on model
   Goal is to have a line drawn between the observed and predicted \
  values to aid in visualization*)

   ListPointPlot3D[ {xyzData, predictedZ},
    PlotRange -> All,
    PlotStyle -> {Directive[Black, PointSize[Medium]], 
      Directive[Red, PointSize[Small]]},
    Filling -> {1 -> {{2}, {Red, Blue}}}(*this doesn't work, 
    nor does "Filling -> 1\[Rule]{2}" or "Filling -> {1\[Rule]2}" *)
   ],

   (*create a plane in 3D space of the expected values based on the model.
   The predicted values should lie on this plane
    *)

    Plot3D[model[x, y] , {x, xMin, xMax}, {y, yMin, yMax}, 
        PlotStyle -> Directive[Opacity[0.1], Specularity[], Glow[White]],
        Mesh -> 8,
        ViewVertical -> {0, 0, 1}], 

       PlotRange -> All, 
       AxesLabel -> {"X", "Y", "Z"}, 
       LabelStyle -> Directive[FontFamily -> "Helvetica"]];

showPlot3D = Show[plot3d]
$\endgroup$
1
  • $\begingroup$ If I understand correctly, you want to see lines joining your data points to the surface of your fitted model? $\endgroup$ Commented May 4, 2015 at 19:19

1 Answer 1

3
$\begingroup$

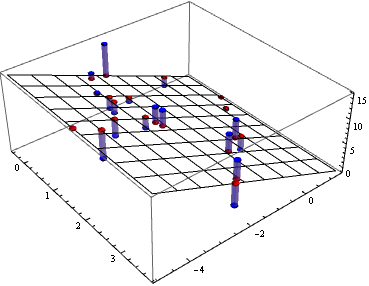
Update: Another work-around: Use DiscretePlot3D

You can use the datasets xyzData and predictedZ to define two functions, say foo1 and foo2

ClearAll[foo1, foo2];
(foo1[#, #2] = #3) & @@@ xyzData;
(foo2[#, #2] = #3) & @@@ predictedZ;

dp3d = DiscretePlot3D[{foo1[x, y], foo2[x, y]}, 
    {x, xyzData[[All, 1]]}, {y, xyzData[[All, 2]]}, ImageSize -> 400, 
   BoxRatios -> 1, ExtentSize -> 1/10, Filling -> {1 -> {2}}, 
   PlotStyle -> {Blue, Red}, PlotMarkers -> {"Sphere", Small}];

p3d = Plot3D[model[x, y], {x, xMin, xMax}, {y, yMin, yMax}, 
   PlotStyle -> Directive[Opacity[0.1], Specularity[], Glow[White]], 
   Mesh -> 8, ViewVertical -> {0, 0, 1}];

Show[p3d, dp3d]

Mathematica graphics


Original post:

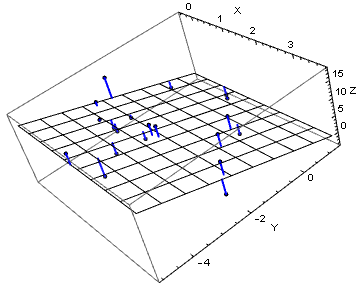
A work-around: add the vertical lines using Graphics3D:

Show[ListPointPlot3D[{xyzData, predictedZ}, PlotRange -> All, 
  PlotStyle -> {Directive[Black, PointSize[Medium]], 
    Directive[Red, PointSize[Small]]}], 
 Plot3D[model[x, y], {x, xMin, xMax}, {y, yMin, yMax}, 
  PlotStyle -> Directive[Opacity[0.1], Specularity[], Glow[White]], 
  Mesh -> 8, ViewVertical -> {0, 0, 1}], 
 Graphics3D[{Blue, Thick, Line /@ Transpose[{xyzData, predictedZ}]}], 
 PlotRange -> All, AxesLabel -> {"X", "Y", "Z"}, 
 LabelStyle -> Directive[FontFamily -> "Helvetica"]]

Mathematica graphics

$\endgroup$
2
  • $\begingroup$ Thanks. These are both nice solutions. I had hoped I would be able to use the Filling option instead of coding further, but a solution in hand is worth 2 in the bush! $\endgroup$ Commented May 4, 2015 at 20:13
  • $\begingroup$ @mikemtnbikes, it seems that, for ListPointPlot3D , ListPlot3D and Plot3D, the possible settings for the Filling option are much more limited than the 2D versions. This limitation is not mentioned explicitly in docs, but, as far as i can tell, all the Filling examples for 3D plots (except DiscretePlot3D) show fillings from a surface or a point to a plane. $\endgroup$
    – kglr
    Commented May 4, 2015 at 20:52

Your Answer

By clicking “Post Your Answer”, you agree to our terms of service and acknowledge you have read our privacy policy.

Not the answer you're looking for? Browse other questions tagged or ask your own question.