In mathematica 12.0, the following code
Show[
 {Plot[PDF[NormalDistribution[i, 1], x] Exp[-Sqrt[i]/4] /.
      i -> Range[1, 3, 2] // Evaluate, {x, -3, 8}, PlotRange -> All,
     Axes -> None, PlotStyle -> {Black, Gray}],
   Table[Plot[
     PDF[NormalDistribution[i, 1], x] Exp[-Sqrt[i]/4] /.
       i -> Range[1, 3, 2] // Evaluate, {x, k, k + 1},
     PlotRange -> Full, Filling -> Axis, Axes -> None,
     PlotStyle -> {ColorData[10][4 + k],
       Darker[ColorData[10][4 + k], 0.3]}], {k, -3, 5}]} // Flatten,
 PlotRange -> {0, 1/3}]
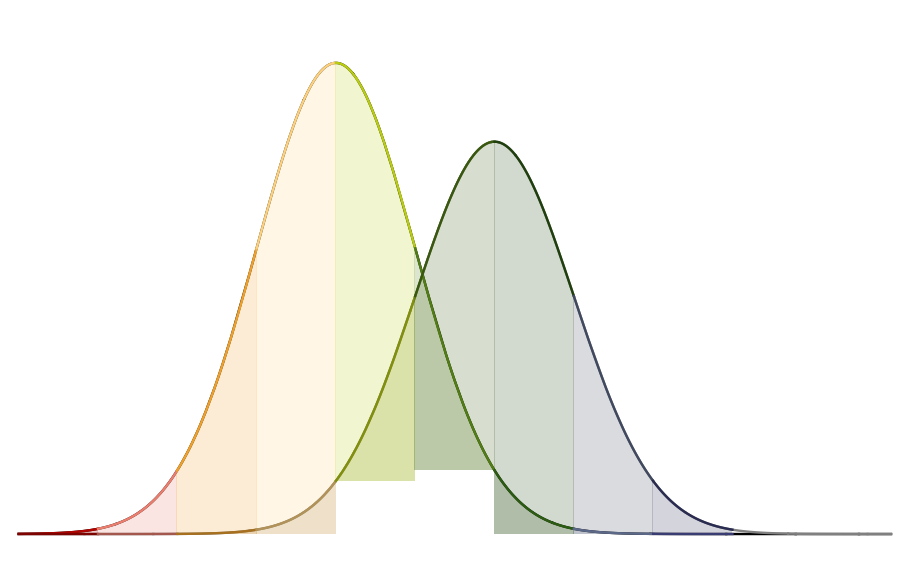
produces the following plot
It seems to me the (square like white) gap near the bottom is unexpected (?)


