PolarPlot[{theta, Exp[theta]}, {theta, 1, 1.2},
    Frame -> True,
    PlotLegends -> "Expressions"
]
Looked into the filling option but does not seem to be able to make it work in the case...
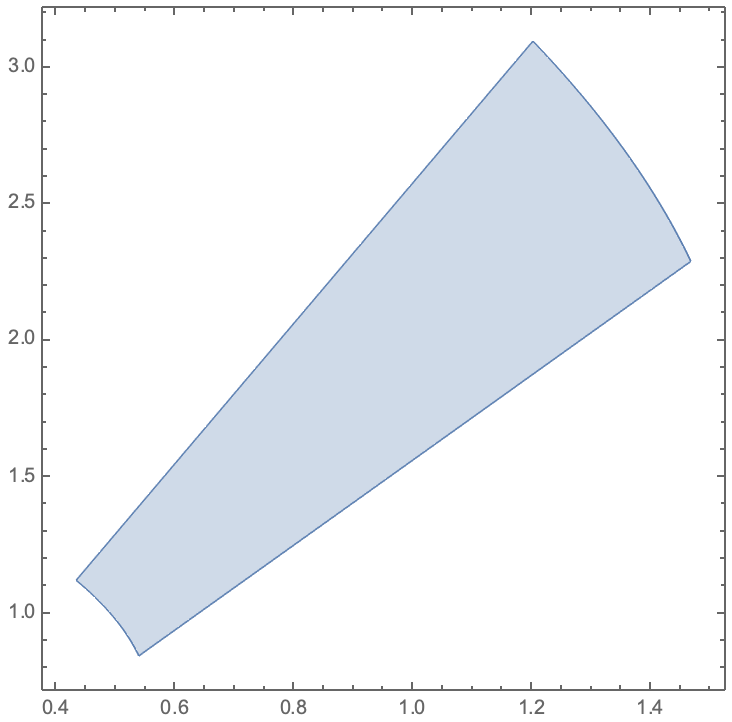
Trying to make a visual of this
One way is to use ParametricPlot, which let's us introduce a second variable that lerps between the expressions:
ParametricPlot[
  (w*θ + (1-w)*Exp[θ]){Cos[θ], Sin[θ]},
  {θ, 1, 1.2},
  {w, 0, 1},
  AspectRatio -> 1,
  Axes -> False
]

Show[ ParametricPlot[(w*θ+ (1 - w)*Exp[θ]) {Cos[θ], Sin[θ]}, {θ, 1, 1.2}, {w, 0, 1}, AspectRatio -> 1, Axes -> False, BoundaryStyle -> None], PolarPlot[{theta, Exp[theta]}, {theta, 1, 1.2}, Frame -> True, PlotLegends -> "Expressions"]]
$\endgroup$
Commented
Mar 19, 2022 at 14:04
You can use ParametricRegion and overlay it on your original plot using Show:
Show[
     Region[ParametricRegion[(w*θ + (1 - w)* Exp[θ]) {Cos[θ], Sin[θ]}, {{θ, 1, 1.2}, {w, 0, 1}}]]
     , PolarPlot[{θ, Exp[θ]}, {θ, 1, 1.2}, Frame ->True, PlotLegends -> "Expressions"]
]
Region partially obscures the plot. Recommend that you reverse the order in the Show, i.e., Show[Region[ParametricRegion[(w*θ + (1 - w)*Exp[θ]) {Cos[θ], Sin[θ]}, {{θ, 1, 1.2}, {w, 0, 1}}], Frame -> True], PolarPlot[{θ, Exp[θ]}, {θ, 1, 1.2}, Frame -> True, PlotLegends -> "Expressions"]]
$\endgroup$
Commented
Mar 19, 2022 at 14:18
plot = PolarPlot[{theta, Exp[theta]}, {theta, 1, 1.2}, Frame -> True,
   PlotLegends -> "Expressions",PlotRange -> All];
{pts1, pts2} = Cases[plot, Line[a_] :> a, Infinity];
area = Polygon[Join[pts1, Reverse@pts2]];
Show[plot, Graphics[{Cyan, area}]]
area // Area
0.787193
ParametricPlot[θ*{Cos[θ], Sin[θ]}*(1 - s) + E^θ {Cos[θ], Sin[θ]}*s, {θ, 1, 1.2}, {s, 0, 1}, PlotStyle -> Brown, MeshFunctions -> {#4 &}, Mesh -> {{{0, Directive[AbsoluteThickness[4], Green]}, {1, Directive[AbsoluteThickness[4], Red]}}}, BoundaryStyle -> None, Frame -> True, Axes -> False, PlotRange -> All]
$\endgroup$
Show, i.e., Show[Graphics[{Cyan, area}, Frame -> True], plot]
$\endgroup$
Commented
Mar 19, 2022 at 14:12