added 1 character in body
Source Link
Conor Cosnett
  • 7.7k
  • 1
  • 24
  • 47

You can use ParametricRegion and overlay it on your original plot using Show:

Show[
     PolarPlot[{θ, Exp[θ]}, {θ, 1, 1.2}, Frame ->True, PlotLegends -> "Expressions"]
   , Region[ParametricRegion[(w*θ + (1 - w)* Exp[θ]) {Cos[θ], Sin[θ]}, {{θ, 1, 1.2}, {w, 0, 1}}]]
     , PolarPlot[{θ, Exp[θ]}, {θ, 1, 1.2}, Frame ->True, PlotLegends -> "Expressions"]
]

enter image description here

You can use ParametricRegion and overlay it on your original plot using Show:

Show[
     PolarPlot[{θ, Exp[θ]}, {θ, 1, 1.2}, Frame ->True, PlotLegends -> "Expressions"]
   , Region[ParametricRegion[(w*θ + (1 - w)* Exp[θ]) {Cos[θ], Sin[θ]}, {{θ, 1, 1.2}, {w, 0, 1}}]] 
]

enter image description here

You can use ParametricRegion and overlay it on your original plot using Show:

Show[
     Region[ParametricRegion[(w*θ + (1 - w)* Exp[θ]) {Cos[θ], Sin[θ]}, {{θ, 1, 1.2}, {w, 0, 1}}]]
     , PolarPlot[{θ, Exp[θ]}, {θ, 1, 1.2}, Frame ->True, PlotLegends -> "Expressions"]
]
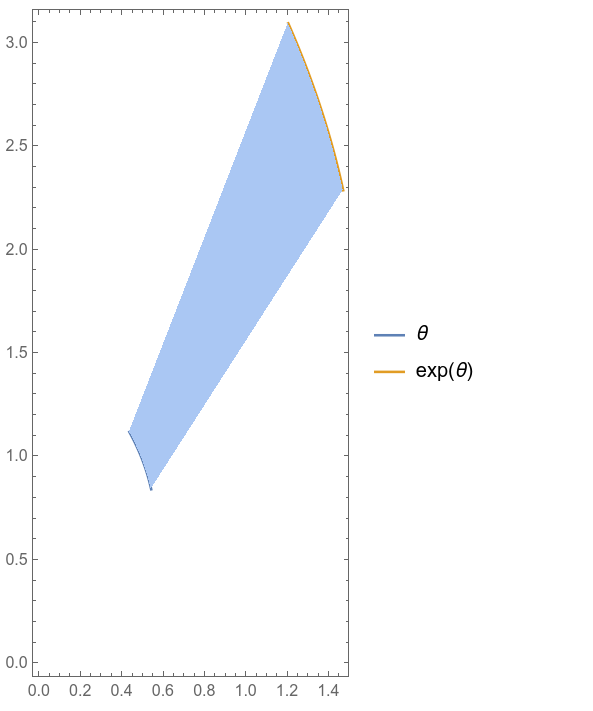
enter image description here

deleted 14 characters in body
Source Link
Conor Cosnett
  • 7.7k
  • 1
  • 24
  • 47

Alternatively youYou can use ParametricRegion and combineoverlay it on your original plot using Show:

Show[
     PolarPlot[{θ, Exp[θ]}, {θ, 1, 1.2}, Frame ->True, PlotLegends -> "Expressions"]
   , Region[ParametricRegion[(w*θ + (1 - w)* Exp[θ]) {Cos[θ], Sin[θ]}, {{θ, 1, 1.2}, {w, 0, 1}}]] 
]

enter image description here

Alternatively you can use ParametricRegion and combine it on your original plot using Show:

Show[
     PolarPlot[{θ, Exp[θ]}, {θ, 1, 1.2}, Frame ->True, PlotLegends -> "Expressions"]
   , Region[ParametricRegion[(w*θ + (1 - w)* Exp[θ]) {Cos[θ], Sin[θ]}, {{θ, 1, 1.2}, {w, 0, 1}}]] 
]

enter image description here

You can use ParametricRegion and overlay it on your original plot using Show:

Show[
     PolarPlot[{θ, Exp[θ]}, {θ, 1, 1.2}, Frame ->True, PlotLegends -> "Expressions"]
   , Region[ParametricRegion[(w*θ + (1 - w)* Exp[θ]) {Cos[θ], Sin[θ]}, {{θ, 1, 1.2}, {w, 0, 1}}]] 
]

enter image description here

Source Link
Conor Cosnett
  • 7.7k
  • 1
  • 24
  • 47

Alternatively you can use ParametricRegion and combine it on your original plot using Show:

Show[
     PolarPlot[{θ, Exp[θ]}, {θ, 1, 1.2}, Frame ->True, PlotLegends -> "Expressions"]
   , Region[ParametricRegion[(w*θ + (1 - w)* Exp[θ]) {Cos[θ], Sin[θ]}, {{θ, 1, 1.2}, {w, 0, 1}}]] 
]

enter image description here