deleted 84 characters in body
Source Link
kglr
  • 400.5k
  • 18
  • 488
  • 929

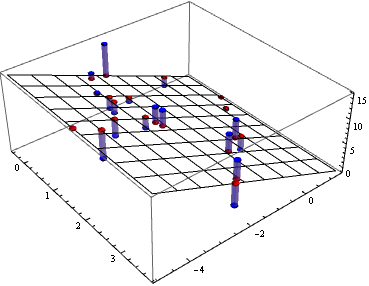
Update: Another work-around: Use DiscretePlot3D

You can use the datasets xyzData and predictedZ to define two functions, say foo1 and foo2

ClearAll[foo1, foo2];
(foo1[Sequence @@foo1[#, #1]#2] = #2#3) & @@@ (xyzData /. {a_, b_, c_} :> {{a, b}, c});xyzData;
(foo2[Sequence @@foo2[#, #1]#2] = #2#3) & @@@ (predictedZ /. {a_, b_, c_} :> {{a, b}, c});predictedZ;

dp3d = DiscretePlot3D[{foo1[x, y], foo2[x, y]}, 
    {x, xyzData[[All, 1]]}, {y, xyzData[[All, 2]]}, ImageSize -> 400, 
   BoxRatios -> 1, ExtentSize -> 1/10, Filling -> {1 -> {2}}, 
   PlotStyle -> {Blue, Red}, PlotMarkers -> {"Sphere", Small}];

p3d = Plot3D[model[x, y], {x, xMin, xMax}, {y, yMin, yMax}, 
   PlotStyle -> Directive[Opacity[0.1], Specularity[], Glow[White]], 
   Mesh -> 8, ViewVertical -> {0, 0, 1}];

Show[p3d, dp3d]
Mathematica graphics


Original post:

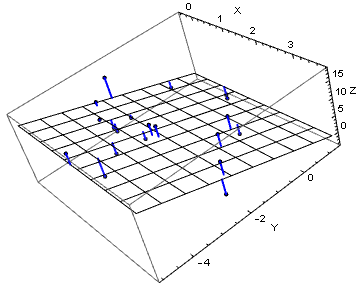
A work-around: add the vertical lines using Graphics3D:

Show[ListPointPlot3D[{xyzData, predictedZ}, PlotRange -> All, 
  PlotStyle -> {Directive[Black, PointSize[Medium]], 
    Directive[Red, PointSize[Small]]}], 
 Plot3D[model[x, y], {x, xMin, xMax}, {y, yMin, yMax}, 
  PlotStyle -> Directive[Opacity[0.1], Specularity[], Glow[White]], 
  Mesh -> 8, ViewVertical -> {0, 0, 1}], 
 Graphics3D[{Blue, Thick, Line /@ Transpose[{xyzData, predictedZ}]}], 
 PlotRange -> All, AxesLabel -> {"X", "Y", "Z"}, 
 LabelStyle -> Directive[FontFamily -> "Helvetica"]]
Mathematica graphics

Update: Another work-around: Use DiscretePlot3D

You can use the datasets xyzData and predictedZ to define two functions, say foo1 and foo2

ClearAll[foo1, foo2];
(foo1[Sequence @@ #1] = #2) & @@@ (xyzData /. {a_, b_, c_} :> {{a, b}, c});
(foo2[Sequence @@ #1] = #2) & @@@ (predictedZ /. {a_, b_, c_} :> {{a, b}, c});

dp3d = DiscretePlot3D[{foo1[x, y], foo2[x, y]}, 
    {x, xyzData[[All, 1]]}, {y, xyzData[[All, 2]]}, ImageSize -> 400, 
   BoxRatios -> 1, ExtentSize -> 1/10, Filling -> {1 -> {2}}, 
   PlotStyle -> {Blue, Red}, PlotMarkers -> {"Sphere", Small}];

p3d = Plot3D[model[x, y], {x, xMin, xMax}, {y, yMin, yMax}, 
   PlotStyle -> Directive[Opacity[0.1], Specularity[], Glow[White]], 
   Mesh -> 8, ViewVertical -> {0, 0, 1}];

Show[p3d, dp3d]

Mathematica graphics


Original post:

A work-around: add the vertical lines using Graphics3D:

Show[ListPointPlot3D[{xyzData, predictedZ}, PlotRange -> All, 
  PlotStyle -> {Directive[Black, PointSize[Medium]], 
    Directive[Red, PointSize[Small]]}], 
 Plot3D[model[x, y], {x, xMin, xMax}, {y, yMin, yMax}, 
  PlotStyle -> Directive[Opacity[0.1], Specularity[], Glow[White]], 
  Mesh -> 8, ViewVertical -> {0, 0, 1}], 
 Graphics3D[{Blue, Thick, Line /@ Transpose[{xyzData, predictedZ}]}], 
 PlotRange -> All, AxesLabel -> {"X", "Y", "Z"}, 
 LabelStyle -> Directive[FontFamily -> "Helvetica"]]

Mathematica graphics

Update: Another work-around: Use DiscretePlot3D

You can use the datasets xyzData and predictedZ to define two functions, say foo1 and foo2

ClearAll[foo1, foo2];
(foo1[#, #2] = #3) & @@@ xyzData;
(foo2[#, #2] = #3) & @@@ predictedZ;

dp3d = DiscretePlot3D[{foo1[x, y], foo2[x, y]}, 
    {x, xyzData[[All, 1]]}, {y, xyzData[[All, 2]]}, ImageSize -> 400, 
   BoxRatios -> 1, ExtentSize -> 1/10, Filling -> {1 -> {2}}, 
   PlotStyle -> {Blue, Red}, PlotMarkers -> {"Sphere", Small}];

p3d = Plot3D[model[x, y], {x, xMin, xMax}, {y, yMin, yMax}, 
   PlotStyle -> Directive[Opacity[0.1], Specularity[], Glow[White]], 
   Mesh -> 8, ViewVertical -> {0, 0, 1}];

Show[p3d, dp3d]

Mathematica graphics


Original post:

A work-around: add the vertical lines using Graphics3D:

Show[ListPointPlot3D[{xyzData, predictedZ}, PlotRange -> All, 
  PlotStyle -> {Directive[Black, PointSize[Medium]], 
    Directive[Red, PointSize[Small]]}], 
 Plot3D[model[x, y], {x, xMin, xMax}, {y, yMin, yMax}, 
  PlotStyle -> Directive[Opacity[0.1], Specularity[], Glow[White]], 
  Mesh -> 8, ViewVertical -> {0, 0, 1}], 
 Graphics3D[{Blue, Thick, Line /@ Transpose[{xyzData, predictedZ}]}], 
 PlotRange -> All, AxesLabel -> {"X", "Y", "Z"}, 
 LabelStyle -> Directive[FontFamily -> "Helvetica"]]

Mathematica graphics

added 937 characters in body
Source Link
kglr
  • 400.5k
  • 18
  • 488
  • 929

Update: Another work-around: Use DiscretePlot3D

You can use the datasets xyzData and predictedZ to define two functions, say foo1 and foo2

ClearAll[foo1, foo2];
(foo1[Sequence @@ #1] = #2) & @@@ (xyzData /. {a_, b_, c_} :> {{a, b}, c});
(foo2[Sequence @@ #1] = #2) & @@@ (predictedZ /. {a_, b_, c_} :> {{a, b}, c});

dp3d = DiscretePlot3D[{foo1[x, y], foo2[x, y]}, 
    {x, xyzData[[All, 1]]}, {y, xyzData[[All, 2]]}, ImageSize -> 400, 
   BoxRatios -> 1, ExtentSize -> 1/10, Filling -> {1 -> {2}}, 
   PlotStyle -> {Blue, Red}, PlotMarkers -> {"Sphere", Small}];

p3d = Plot3D[model[x, y], {x, xMin, xMax}, {y, yMin, yMax}, 
   PlotStyle -> Directive[Opacity[0.1], Specularity[], Glow[White]], 
   Mesh -> 8, ViewVertical -> {0, 0, 1}];

Show[p3d, dp3d]

Mathematica graphics


Original post:

A work-around: add the vertical lines using Graohics3DGraphics3D:

Show[ListPointPlot3D[{xyzData, predictedZ}, PlotRange -> All, 
  PlotStyle -> {Directive[Black, PointSize[Medium]], 
    Directive[Red, PointSize[Small]]}], 
 Plot3D[model[x, y], {x, xMin, xMax}, {y, yMin, yMax}, 
  PlotStyle -> Directive[Opacity[0.1], Specularity[], Glow[White]], 
  Mesh -> 8, ViewVertical -> {0, 0, 1}], 
 Graphics3D[{Blue, Thick, Line /@ Transpose[{xyzData, predictedZ}]}], 
 PlotRange -> All, AxesLabel -> {"X", "Y", "Z"}, 
 LabelStyle -> Directive[FontFamily -> "Helvetica"]]

Mathematica graphics

A work-around: add the vertical lines using Graohics3D:

Show[ListPointPlot3D[{xyzData, predictedZ}, PlotRange -> All, 
  PlotStyle -> {Directive[Black, PointSize[Medium]], 
    Directive[Red, PointSize[Small]]}], 
 Plot3D[model[x, y], {x, xMin, xMax}, {y, yMin, yMax}, 
  PlotStyle -> Directive[Opacity[0.1], Specularity[], Glow[White]], 
  Mesh -> 8, ViewVertical -> {0, 0, 1}], 
 Graphics3D[{Blue, Thick, Line /@ Transpose[{xyzData, predictedZ}]}], 
 PlotRange -> All, AxesLabel -> {"X", "Y", "Z"}, 
 LabelStyle -> Directive[FontFamily -> "Helvetica"]]

Mathematica graphics

Update: Another work-around: Use DiscretePlot3D

You can use the datasets xyzData and predictedZ to define two functions, say foo1 and foo2

ClearAll[foo1, foo2];
(foo1[Sequence @@ #1] = #2) & @@@ (xyzData /. {a_, b_, c_} :> {{a, b}, c});
(foo2[Sequence @@ #1] = #2) & @@@ (predictedZ /. {a_, b_, c_} :> {{a, b}, c});

dp3d = DiscretePlot3D[{foo1[x, y], foo2[x, y]}, 
    {x, xyzData[[All, 1]]}, {y, xyzData[[All, 2]]}, ImageSize -> 400, 
   BoxRatios -> 1, ExtentSize -> 1/10, Filling -> {1 -> {2}}, 
   PlotStyle -> {Blue, Red}, PlotMarkers -> {"Sphere", Small}];

p3d = Plot3D[model[x, y], {x, xMin, xMax}, {y, yMin, yMax}, 
   PlotStyle -> Directive[Opacity[0.1], Specularity[], Glow[White]], 
   Mesh -> 8, ViewVertical -> {0, 0, 1}];

Show[p3d, dp3d]

Mathematica graphics


Original post:

A work-around: add the vertical lines using Graphics3D:

Show[ListPointPlot3D[{xyzData, predictedZ}, PlotRange -> All, 
  PlotStyle -> {Directive[Black, PointSize[Medium]], 
    Directive[Red, PointSize[Small]]}], 
 Plot3D[model[x, y], {x, xMin, xMax}, {y, yMin, yMax}, 
  PlotStyle -> Directive[Opacity[0.1], Specularity[], Glow[White]], 
  Mesh -> 8, ViewVertical -> {0, 0, 1}], 
 Graphics3D[{Blue, Thick, Line /@ Transpose[{xyzData, predictedZ}]}], 
 PlotRange -> All, AxesLabel -> {"X", "Y", "Z"}, 
 LabelStyle -> Directive[FontFamily -> "Helvetica"]]

Mathematica graphics

Source Link
kglr
  • 400.5k
  • 18
  • 488
  • 929

A work-around: add the vertical lines using Graohics3D:

Show[ListPointPlot3D[{xyzData, predictedZ}, PlotRange -> All, 
  PlotStyle -> {Directive[Black, PointSize[Medium]], 
    Directive[Red, PointSize[Small]]}], 
 Plot3D[model[x, y], {x, xMin, xMax}, {y, yMin, yMax}, 
  PlotStyle -> Directive[Opacity[0.1], Specularity[], Glow[White]], 
  Mesh -> 8, ViewVertical -> {0, 0, 1}], 
 Graphics3D[{Blue, Thick, Line /@ Transpose[{xyzData, predictedZ}]}], 
 PlotRange -> All, AxesLabel -> {"X", "Y", "Z"}, 
 LabelStyle -> Directive[FontFamily -> "Helvetica"]]

Mathematica graphics