5
$\begingroup$

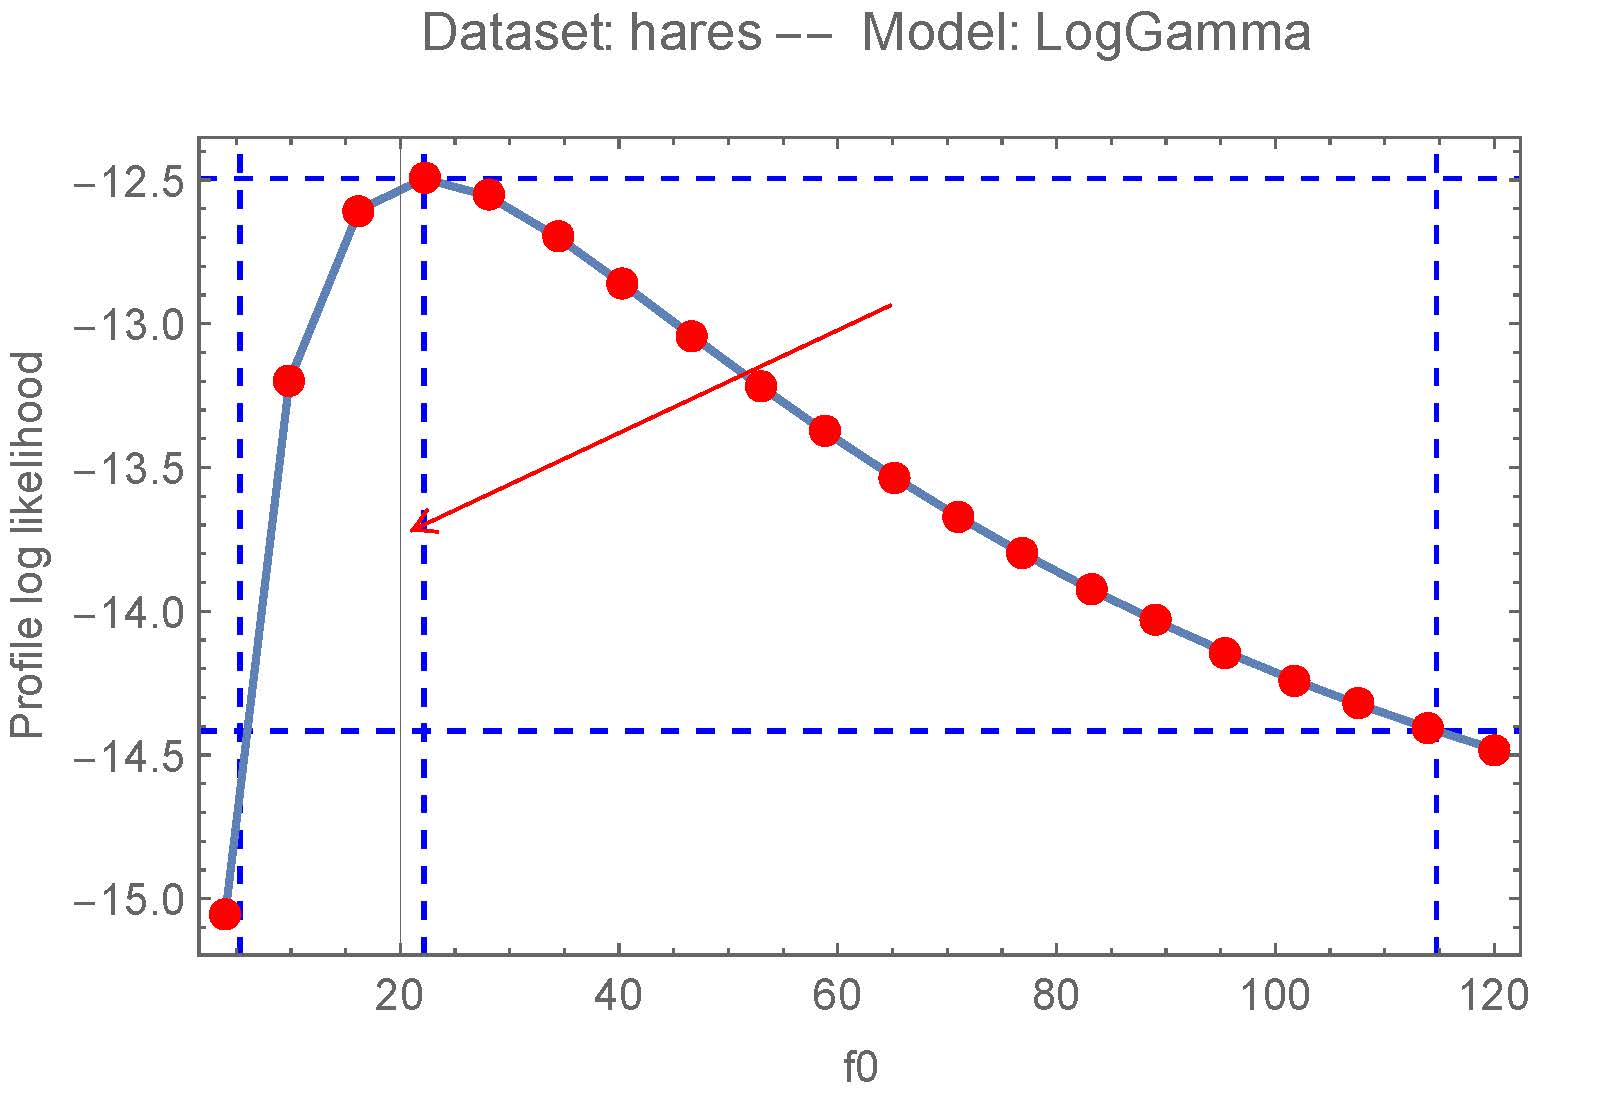
enter image description here

Where does this gray solid line come from? It's not y=0 or x=0. Sometimes it occurs, sometime does not.

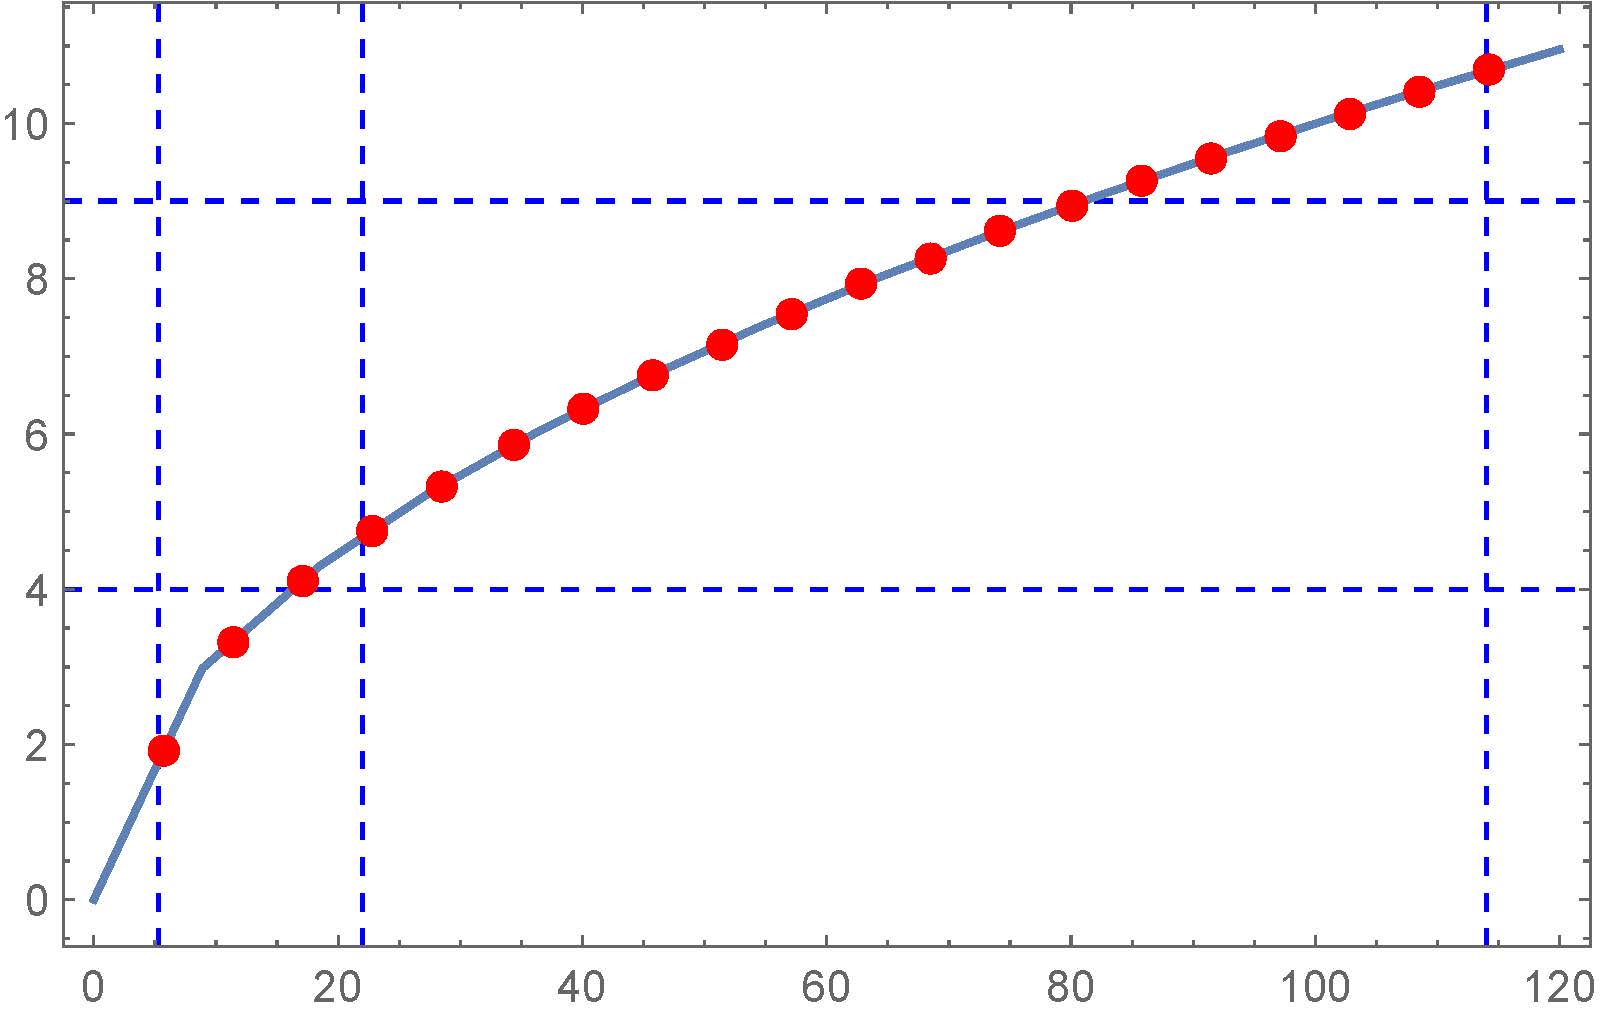
I can't really produce a smaller example that does the same thing as it is really "random". The full code is a bit long but some dummy code:

Plot[f0val^0.5, {f0val, 0, 120}, MaxRecursion -> 0, 
 MeshStyle -> {PointSize[Large], Red}, Mesh -> 20, Frame -> True, 
 ImageSize -> Medium, GridLines -> {{5.3, 114, 22}, {4, 9}}, 
 GridLinesStyle -> {Directive[Dashed, Blue], Directive[Dashed, Blue]},
 PlotRange -> Full, PlotPoints -> 14]

This has ALL options that I used to produce the first graph except the data(function used).

I hope it's enough to identify the problem?
enter image description here

$\endgroup$
4
  • 4
    $\begingroup$ Try Axes -> None $\endgroup$
    – wxffles
    Commented Feb 9, 2015 at 23:21
  • $\begingroup$ @wxffles Thanks! I see that someone had voted to close this. I might delete it myself if there are more people thinking the same thing. $\endgroup$ Commented Feb 9, 2015 at 23:43
  • $\begingroup$ @wxffles, your observation is probably worth an answer. It's not easy to figure out that Axes are the problem from the documentation. Chen Stats Yu, the close vote was because someone thought the code did not reproduce the problem. If I change the interval to {f0val, 5, 120}, I get the gray line on V10.0.2. (The important thing is not to include zero, I think.) $\endgroup$
    – Michael E2
    Commented Feb 9, 2015 at 23:51
  • $\begingroup$ I have expanded my comment into an answer. I agree that it is a good question. The simple answer is just one of those things you remember with experience. $\endgroup$
    – wxffles
    Commented Feb 10, 2015 at 0:09

1 Answer 1

12
$\begingroup$

A simple example of the problem can be generated with:

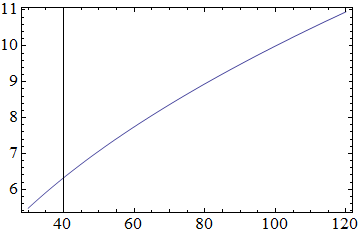
Plot[x^0.5, {x, 30, 120}, Frame -> True]

1

Here we have a vertical line at 40. If we plot this without the frame:

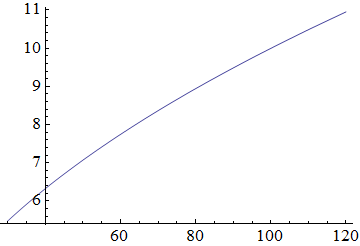
Plot[x^0.5, {x, 30, 120}, Frame -> False]

2

We see that this actually corresponds to the axes that Mathematica generates.

AxesOrigin /. Options@Plot[x^0.5, {x, 30, 120}]

{40., 5.4}

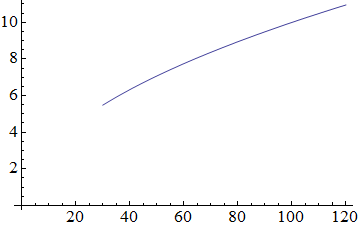
So why would Mathematica make the axes cross there? If it were the usual {0,0} then we'd have a lot of ugly wasted space in our plot:

Plot[x^0.5, {x, 30, 120}, AxesOrigin -> {0, 0}]

3

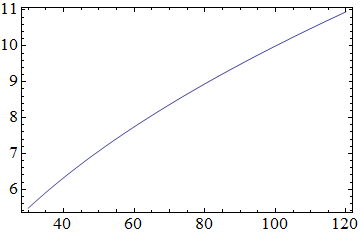
Instead Mathematica will zoom in on the graph we asked for, but it has to adjust the axes origin to fit them in the same picture. When we use a frame we often don't want these axes anymore, so Axes -> None will get rid of them.

Plot[x^0.5, {x, 30, 120}, Frame -> True, Axes -> None]

4

$\endgroup$

Not the answer you're looking for? Browse other questions tagged or ask your own question.