4
$\begingroup$

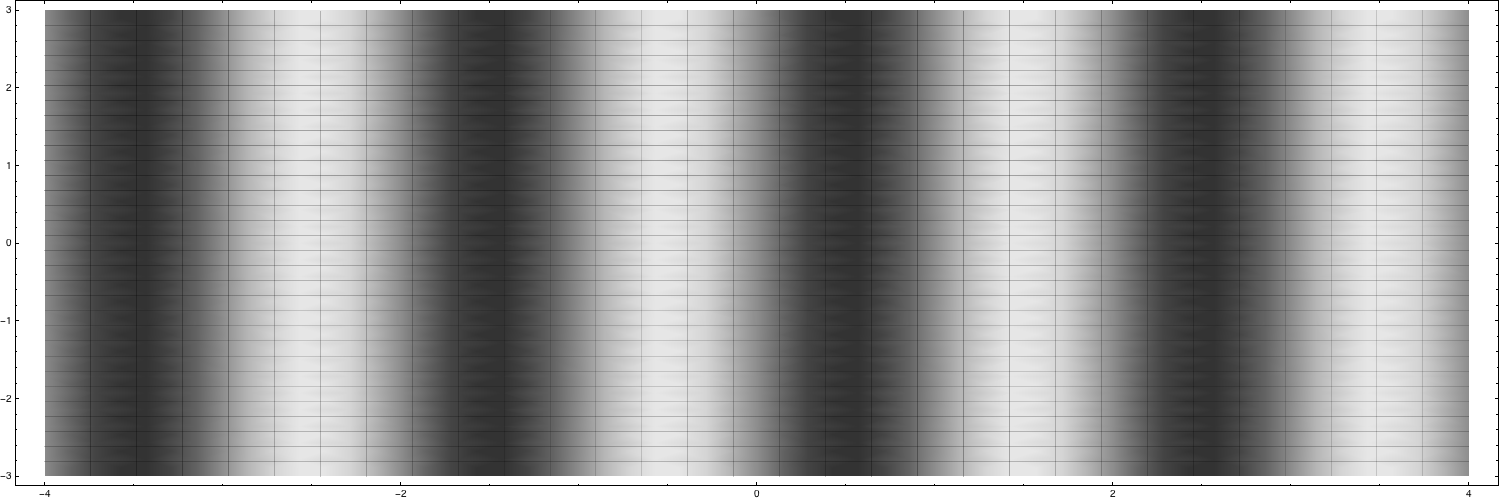
This is suppose to be a simple task but I can not get a simple gray scale density plot. I have tried the color function, but can not get to the one that plots in gray scale or just one color

DensityPlot[Sin[Pi*x - Pi], {x, -4, 4}, {y, -3, 3}, ImageSize -> {1500, 500}, 
  AspectRatio -> Full, ColorFunction -> "BlueGreenYellow", Mesh -> 30]
$\endgroup$

2 Answers 2

7
$\begingroup$

Try

DensityPlot[Sin[Pi*x - Pi], {x, -4, 4}, {y, -3, 3}, ImageSize -> {1500, 500}, 
 AspectRatio -> Full, ColorFunction -> "GrayTones", Mesh -> 30]
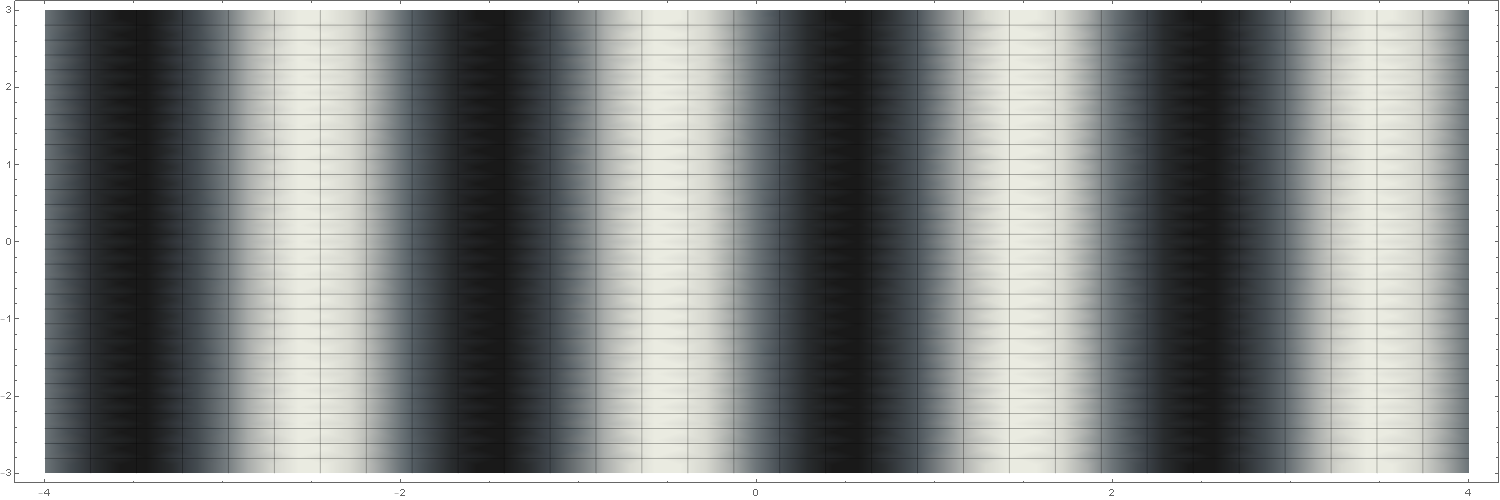
Out

or

DensityPlot[Sin[Pi*x - Pi], {x, -4, 4}, {y, -3, 3}, ImageSize -> {1500, 500}, 
 AspectRatio -> Full, ColorFunction -> "MonochromeFractalGradient", Mesh -> 30]
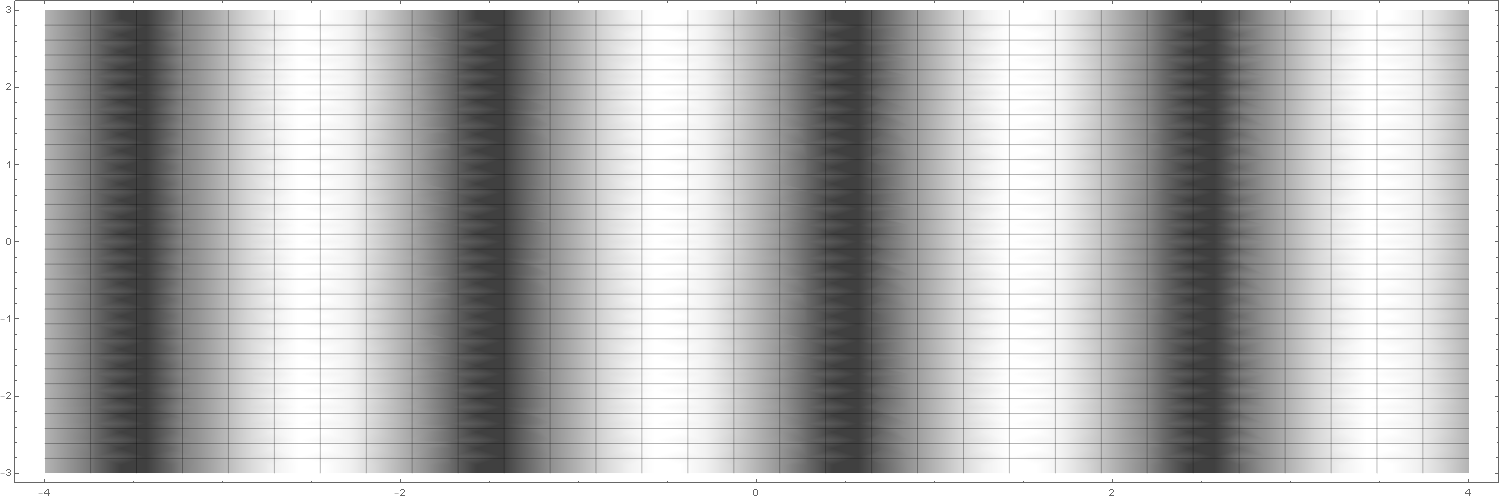
MonochromeFractalGradient

or

DensityPlot[Sin[Pi*x - Pi], {x, -4, 4}, {y, -3, 3}, ImageSize -> {1500, 500}, 
 AspectRatio -> Full, ColorFunction -> (GrayLevel[#] &), Mesh -> 30]
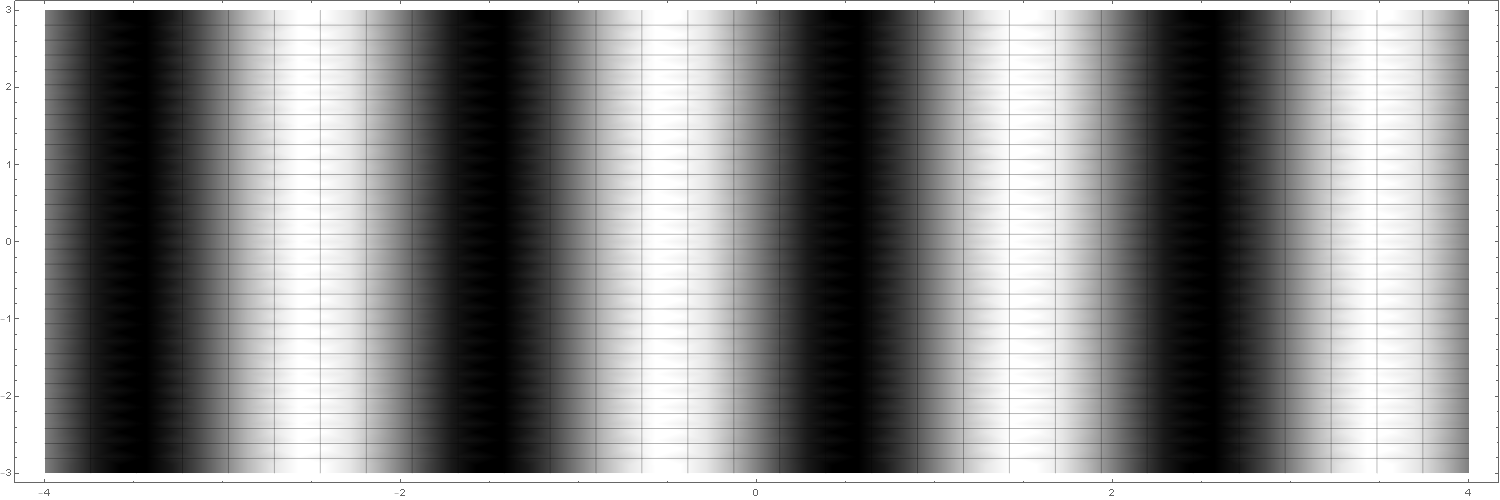
enter image description here

for gray scale, and

DensityPlot[Sin[Pi*x - Pi], {x, -4, 4}, {y, -3, 3}, ImageSize -> {1500, 500}, 
 AspectRatio -> Full, ColorFunction -> (Lighter[Blue, #] &), Mesh -> 30]
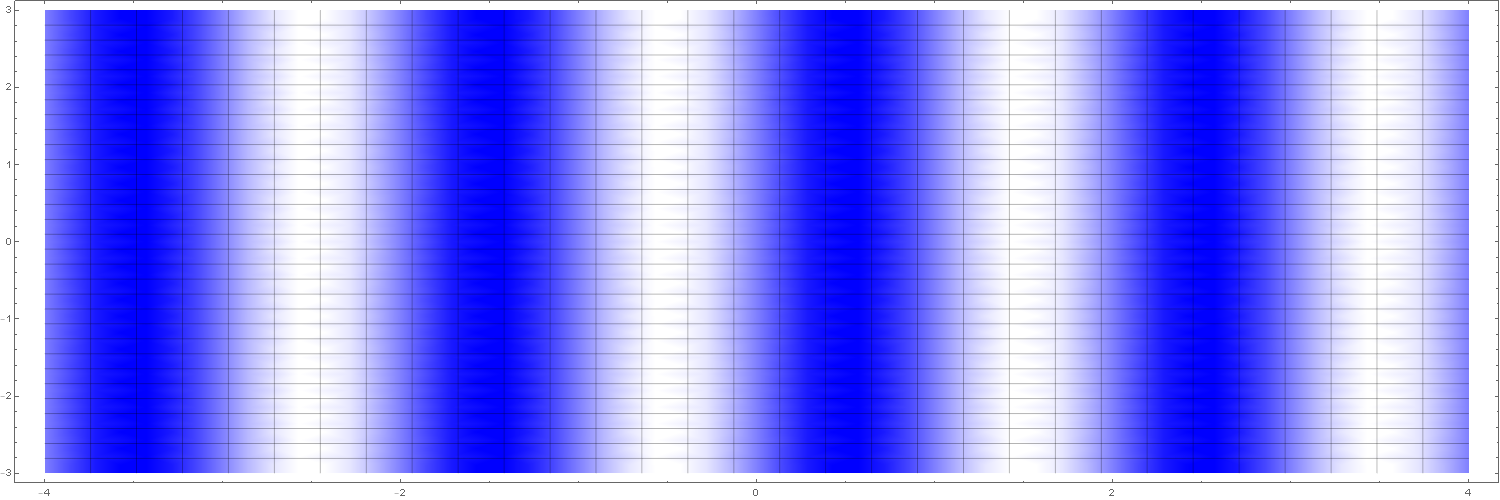
enter image description here

or

DensityPlot[Sin[Pi*x - Pi], {x, -4, 4}, {y, -3, 3}, ImageSize -> {1500, 500}, 
 AspectRatio -> Full, ColorFunction -> (Opacity[1 - #, Blue] &), Mesh -> 30]
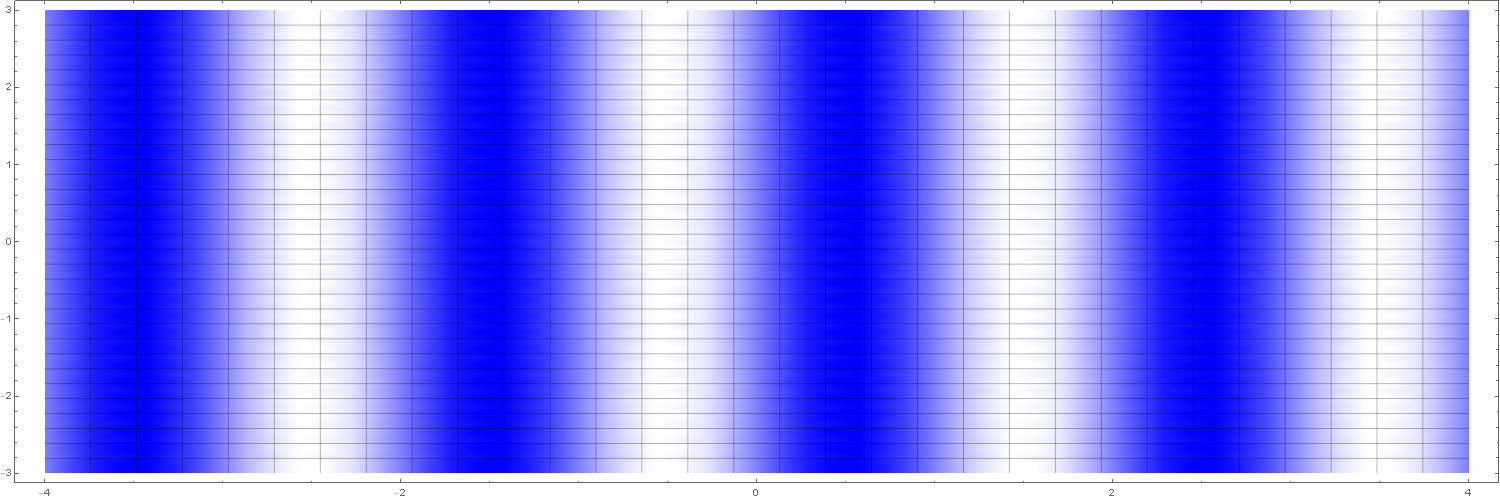
enter image description here

or

DensityPlot[Sin[Pi*x - Pi], {x, -4, 4}, {y, -3, 3}, ImageSize -> {1500, 500}, 
 AspectRatio -> Full, ColorFunction -> (LCHColor[#, 1, 0.8] &), Mesh -> 30]
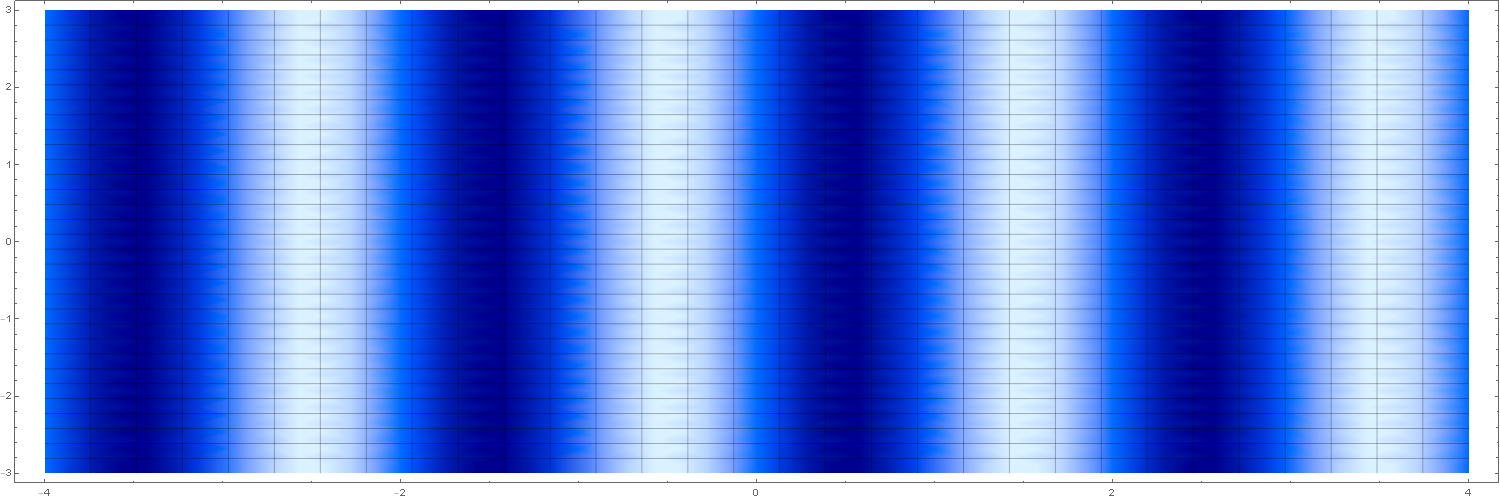
enter image description here

for a single color.

$\endgroup$
4
  • 1
    $\begingroup$ I am rather surprised that "GrayTones" does not produce neutral tones. I guess I always code my own using GrayLevel. $\endgroup$
    – Mr.Wizard
    Commented Aug 15, 2016 at 20:04
  • $\begingroup$ Please, may you elaborate on not produce neutral tones and settign the Graylevel and where do you set this option? $\endgroup$ Commented Aug 17, 2016 at 14:32
  • 1
    $\begingroup$ @Mr.Wizard It's not "AchromaticGrays". "A tone is produced either by the mixture of a color with gray, or ..." 1 Therefore "GrayTones" seems to be an appropriate name. I don't know if "GrayTones" are base on a typical gradient, color perception, or color profile, but its basically GrayLevel + warm and cool gray: ImageAssemple. $\endgroup$
    – Karsten7
    Commented Aug 17, 2016 at 22:49
  • $\begingroup$ @JoseECalderon Sorry, I don't understand your comment. To my understanding something like "neutral tones" don't really exist, that would be called achromatic grays or just gray (see my comment to Mr. Wizard above). My third example show how and where to set the option to use GrayLevel as the ColorFunction. $\endgroup$
    – Karsten7
    Commented Aug 17, 2016 at 22:55
8
$\begingroup$

Replace your ColorFunction -> "BlueGreenYellow" with PlotTheme -> "Monochrome"

Mathematica graphics

$\endgroup$
2
  • $\begingroup$ Alternatively, one can use PlotTheme -> "GrayColor", which is identical to PlotTheme -> "Monochrome", at least for a DensityPlot. $\endgroup$
    – Karsten7
    Commented Aug 17, 2016 at 22:34
  • 1
    $\begingroup$ For "just one color" the corresponding PlotTheme would be, for example, PlotTheme -> {"Monochrome", Blue}. $\endgroup$
    – Karsten7
    Commented Aug 19, 2016 at 3:14

Your Answer

By clicking “Post Your Answer”, you agree to our terms of service and acknowledge you have read our privacy policy.

Not the answer you're looking for? Browse other questions tagged or ask your own question.