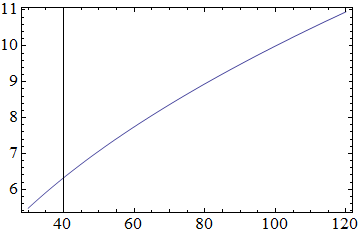
A simple example of the problem can be generated with:
Plot[x^0.5, {x, 30, 120}, Frame -> True]

Here we have a vertical line at 40. If we plot this without the frame:
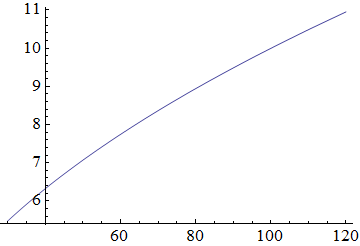
Plot[x^0.5, {x, 30, 120}, Frame -> False]

We see that this actually corresponds to the axes that Mathematica generates.
AxesOrigin /. Options@Plot[x^0.5, {x, 30, 120}]
{40., 5.4}
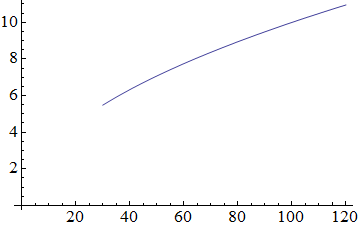
So why would Mathematica make the axes cross there? If it were the usual {0,0} then we'd have a lot of ugly wasted space in our plot:
Plot[x^0.5, {x, 30, 120}, AxesOrigin -> {0, 0}]

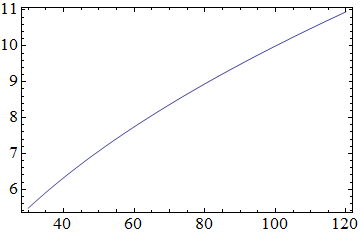
Instead Mathematica will zoom in on the graph we asked for, but it has to adjust the a axes origin to fit them in the same picture. When we use a frame we often don't want these axes anymore, so Axes -> None will get rid of them.
Plot[x^0.5, {x, 30, 120}, Frame -> True, Axes -> None]

