4
$\begingroup$

Given $S \subseteq \mathbb{C}$ I am trying to plot $f(S)$ for given complex valued function $f$

Looking at other answers on this site for similar questions, I came up with this

f = Function[z, 1/Conjugate[z]];

(*Plot limit parameters*)
plimit = 1;
space = 2;
plrange = {{Re[f[-plimit]] - space, Re[f[plimit]] + space},
           {Im[f[-plimit]] - space, Im[f[plimit]] + space}}

ParametricPlot[
  Evaluate@({Re[f[z]], Im[f[z]]}*Boole[Abs[z] < 1] /. z -> x + I*y),
  {x, -plimit, plimit},
  {y, -plimit, plimit}, (*Indicates the rectablge from which the points satisfying Boole[..]==1 will be picked.*)
  PlotRange -> plrange
]

The result of this command is
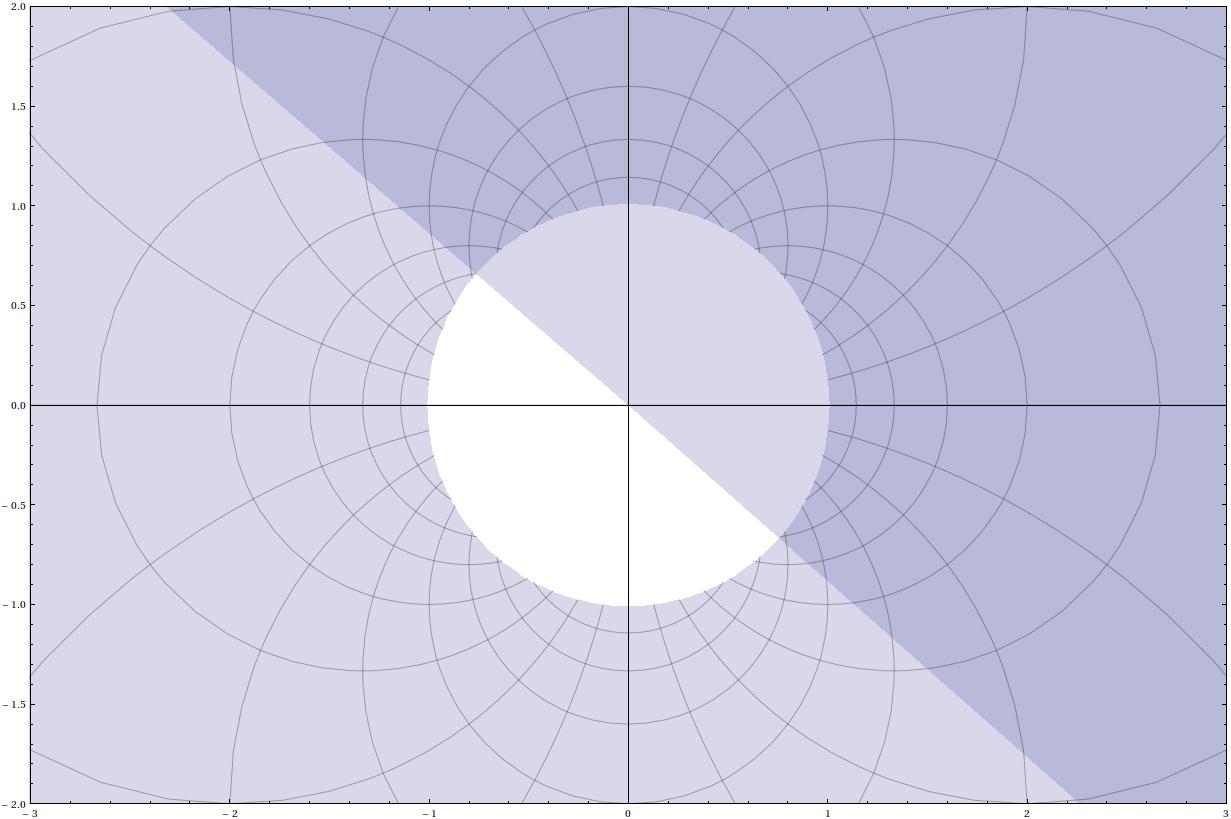
enter image description here

My question is why are there two different colors in this image? One light and one dark. Is the plot trying to tell me something here?

SYSTEM INFORMATION: Version 8.0.1.0 Platform Linux x86(32-bit) Ubuntu 11.04

$\endgroup$
7
  • $\begingroup$ I don't see this behavior on MacOSX and Mathematica 8.0.4. Can you please include information about your system into the question? $\endgroup$
    – halirutan
    Commented Aug 21, 2013 at 20:26
  • $\begingroup$ Please see edit. $\endgroup$ Commented Aug 21, 2013 at 20:29
  • $\begingroup$ I can't see it because it keeps crashing the kernel in V9; I see the shading all the way across in V8.0.4 (not stopping at $y = - x$). There is a discontinuity at Abs[z] == 1, where the parametrization collapses to {0, 0} -- perhaps you want to consider RegionFunction, but I'm not sure exactly what you're trying to do.. $\endgroup$
    – Michael E2
    Commented Aug 21, 2013 at 20:39
  • $\begingroup$ @MichaelE2 I have the same, and it seems to be related to the Boole expression. $\endgroup$ Commented Aug 21, 2013 at 21:22
  • $\begingroup$ This works for me: With[{z = x + I*y}, ParametricPlot[{Re[f[z]]*Boole[Abs[z] < 1], Im[f[z]]*Boole[Abs[z] < 1]}, {x, -plimit, plimit}, {y, -plimit, plimit}, PlotRange -> plrange, RegionFunction -> Function[{x, y}, x^2 + y^2 > 1]]] $\endgroup$ Commented Aug 21, 2013 at 21:25

1 Answer 1

3
$\begingroup$

I believe what we see here is some over-folding artifact. You can prevent this by using RegionFunction to restrict the outside region used to a reasonable size

f = Function[z, 1/Conjugate[z]];
plimit = 1;
space = 2;
plrange = {{Re[f[-plimit]] - space, 
    Re[f[plimit]] + space}, {Im[f[-plimit]] - space, 
    Im[f[plimit]] + space}};

ParametricPlot[
 Evaluate@({Re[f[z]], Im[f[z]]}*Boole[Abs[z] < 1] /. 
    z -> x + I*y), {x, -plimit, plimit}, {y, -plimit, plimit},
 PlotRange -> plrange,
 RegionFunction -> Function[{x, y}, -5 < x < 5 && -5 < y < 5]]

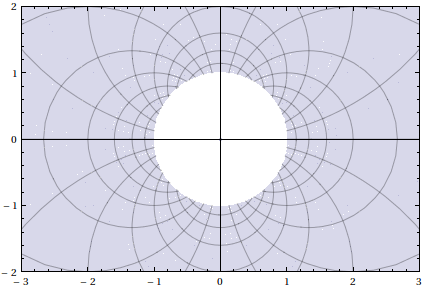
Mathematica graphics

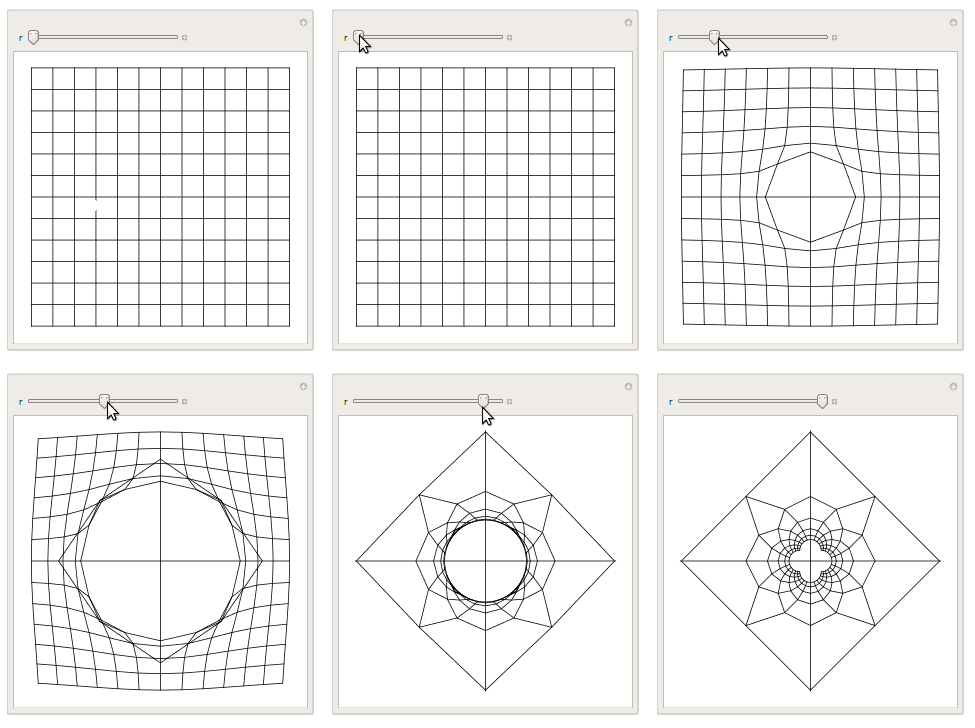
Still, since your example crashes version 9 on my Linux box, I believe there is some deeper issue here indicating a bug in Mathematica. Maybe it doesn't like when you turn the complex plane inside out...

enter image description here

pts = Table[{i, j}, {j, -3, 3, .5}, {i, -3, 3, .5}];
m[{x_, y_}] := {x, y}/(x^2 + y^2 + $MachineEpsilon)
Manipulate[
 With[{points = (1 - r)*pts + r*Map[m, pts, {2}]},
  Graphics[{Line /@ points, Line /@ Transpose[points]}]
  ],
 {r, 0, 1}]
$\endgroup$
1
  • $\begingroup$ This seems like a good work around. Thanks. $\endgroup$ Commented Aug 22, 2013 at 1:07

Your Answer

By clicking “Post Your Answer”, you agree to our terms of service and acknowledge you have read our privacy policy.

Not the answer you're looking for? Browse other questions tagged or ask your own question.