I have a notebook which I cannot make to produce the accurate colors. I'll try to post the code hereafter. It looks a bit messy.
Needs["PlotLegends`"]

b1BlSmall = {4.17891*^-1, 5.59816*^-1, 7.09626*^-1, 4.17891*^-1};
b1BlLarge = {3.15389*^-1, 4.73084*^-1, 6.85972*^-1, 3.62698*^-1};
b2BlSmall = {9.74949*^-1, 9.74949*^-1, 9.74949*^-1, 9.74949*^-1};
b2BlLarge = {9.74949*^-1, 9.74949*^-1, 9.74949*^-1, 2.00000};
dbhAdult = {1.00000*^1, 1.00000*^1, 1.00000*^1, 5.48121};

C2B = 2.0
pftColor = {Green, Darker[Green], Darker[Darker[Green]], Magenta};

size2bl[dbh_,ipft_,a_:1,b_:1,c_:1]:=If[ipft!=4,\[Piecewise] b1BlSmall[[ipft]]/C2B*dbh^b2BlSmall[[ipft]] dbh<dbhAdult[[ipft]]
b1BlLarge[[ipft]]/C2B*dbh^b2BlLarge[[ipft]] True

,\[Piecewise]   (a*b1BlSmall[[ipft]])/C2B*dbh^(b*b2BlSmall[[ipft]]) dbh<dbhAdult[[ipft]]
(a*b1BlLarge[[ipft]])/C2B*dbh^(c*b2BlLarge[[ipft]]) True
];

putzbl[dbh_] := (0.0856*dbh^2 - 0.376)/C2B;


Manipulate[
 Plot[{putzbl[dbh],
   Evaluate@Table[size2bl[dbh, ipft, a, b, c], {ipft, 1, 4}]}, {dbh,
   0.0, 11.0},
  PlotStyle -> Flatten[{Black, pftColor}]],
 {a, 0.8, 1.2}, {b, 0.8, 1.2}, {c, 0.8, 1.2}]
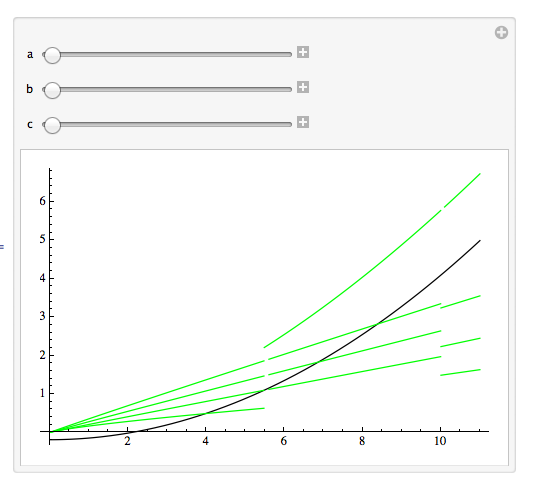
But the graph that I get is like
Since I have five curves (the first is a function of its own, the last four are a family of functions of which only one is to manipulate) I was hoping to use a black line for the first curve and the four colors of pftColor for the latter. How do I do that?
EDIT
According to Kuba's answer:
Manipulate[
 Plot[Evaluate@
   Flatten@{putzbl[dbh],
     Table[size2bl[dbh, ipft, a, b, c], {ipft, 1, 4}]}, {dbh, 0.0,
   11.0},
  PlotStyle -> Flatten[{Black, pftColor}]],
 {a, 0.8, 1.2}, {b, 0.8, 1.2}, {c, 0.8, 1.2}]
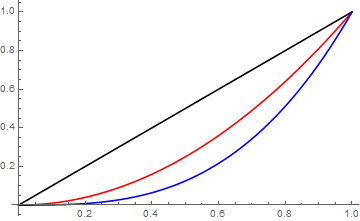
Produce the correct behavior


PlotStyle ->{color1,{color2, color3, color4}}when you should be usingPlotStyle ->{color1, color2, color3, color4}. So replace that option in your code withPlotStyle-> Flatten[{Black,pftColor}]$\endgroup$Plotto have an effect. But still this nested syntax ofPlotStyleis not supported.Flattenthose arguments. And inject the table withWith. $\endgroup$Withfunction but it's not clear to me how I should use it in this case. Also if you can think of another, more effective, syntax to produce the plot let me know. $\endgroup$