3
$\begingroup$

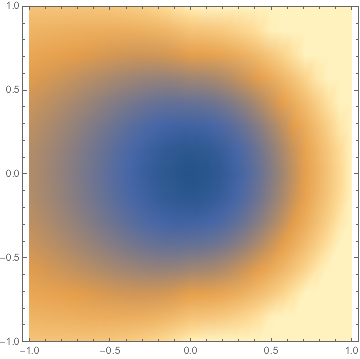
I am trying to align color scale for continuous plots that have different ranges. Here the color scale exhibits a discontinuity even with the same PlotRange

Show[
 DensityPlot[x^2 + y^2, {x, 0, 1}, {y, -1, 1}, PlotRange -> {0, 2}],
 DensityPlot[(x^2 + y^2)*Exp[x], {x, -1, 0}, {y, -1, 1}, 
  PlotRange -> {0, 2}],
 PlotRange -> {{-1, 1}, {-1, 1}}
 ]

Does anyone know how to solve this issue?

Thanks

$\endgroup$

1 Answer 1

4
$\begingroup$

You should have a look at ColorFunctionScaling option. When set to False in your case it gives

Show[
   DensityPlot[x^2 + y^2, {x, 0, 1}, {y, -1, 1}, 
      PlotRange -> {0, 2}, ColorFunctionScaling -> False], 
   DensityPlot[(x^2 + y^2)*Exp[x], {x, -1, 0}, {y, -1, 1}, 
      PlotRange -> {0, 2}, ColorFunctionScaling -> False], 
   PlotRange -> {{-1, 1}, {-1, 1}}
]

enter image description here

An alternative would be to use

f[x_?Positive, y_] := x^2 + y^2
f[x_?Negative, y_] := (x^2 + y^2)*Exp[x];
DensityPlot[f[x, y], {x, -1, 1}, {y, -1, 1}]
$\endgroup$

Your Answer

By clicking “Post Your Answer”, you agree to our terms of service and acknowledge you have read our privacy policy.

Not the answer you're looking for? Browse other questions tagged or ask your own question.