I have the following code:
f = 6;
t0 = 0.0;
t1 = 50.0;
m[t_] := {Cos[2 Pi*f*t], 0.0, 0.0};
Plot[Part[m[t], 1], {t, t0, t1}, Frame -> True,
FrameLabel -> {Style["Time", FontSize -> 16],
Style["Amplitude", FontSize -> 16]},
PlotRange -> All, PlotStyle -> {Red}]
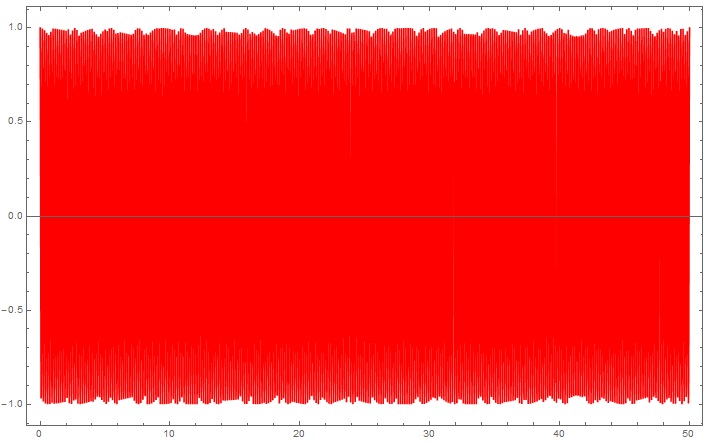
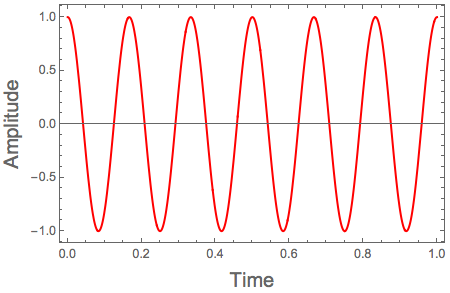
The result is:
I want to rewrite the code using OptionsPattern as follows:
gt0 = 0.0;
gt1 = 50;
gf = 6;

ClearAll[af];
Options[af] = {
T0 -> gt0,
T1 -> gt1,
Frequency -> gf,
};

af[
OptionsPattern[]
] := Module[
{
t0 = OptionValue[T0],
t1 = OptionValue[T1],
f = OptionValue[Frequency],
m, t
},
m = {Cos[2 Pi*f*t], 0.0, 0.0}
]

rmt = af[];

Plot[Part[rmt[t], 1], {t, gt0, gt1}, Frame -> True,
FrameLabel -> {Style["Time", FontSize -> 16],
Style["Amplitude", FontSize -> 16]}, PlotRange -> All,
PlotStyle -> {Red}]
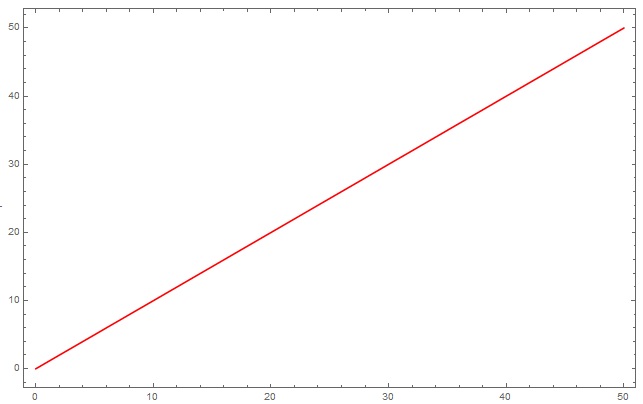
The result is:
Why are these two plots not the same?


