0
$\begingroup$

I have the following 5th degree Polynomial Equation in complex wave velocity w(tauT, tauq) as a function of real parameters taoT and tauq:

eqn = (1 + (c2^2/c1^2)*w^2)*(1 + k*taoT*c2*w + (c2*d/k)*w*(1 + k*tauq*c2*w + (1/2)*k^2*tauq^2*c2^2*w^2)) + (e*c2*d/k)*w*(1 + k*tauq*c2*w + (1/2)*k^2*tauq^2*c2^2*w^2) == 0;

The parameters are given as:

c1=4631.0; c2=2280.1; d=8066.8; e=0.0168; k=1; 

The range for both of taoT and Taoq is:

[10^-10, 10^-1]

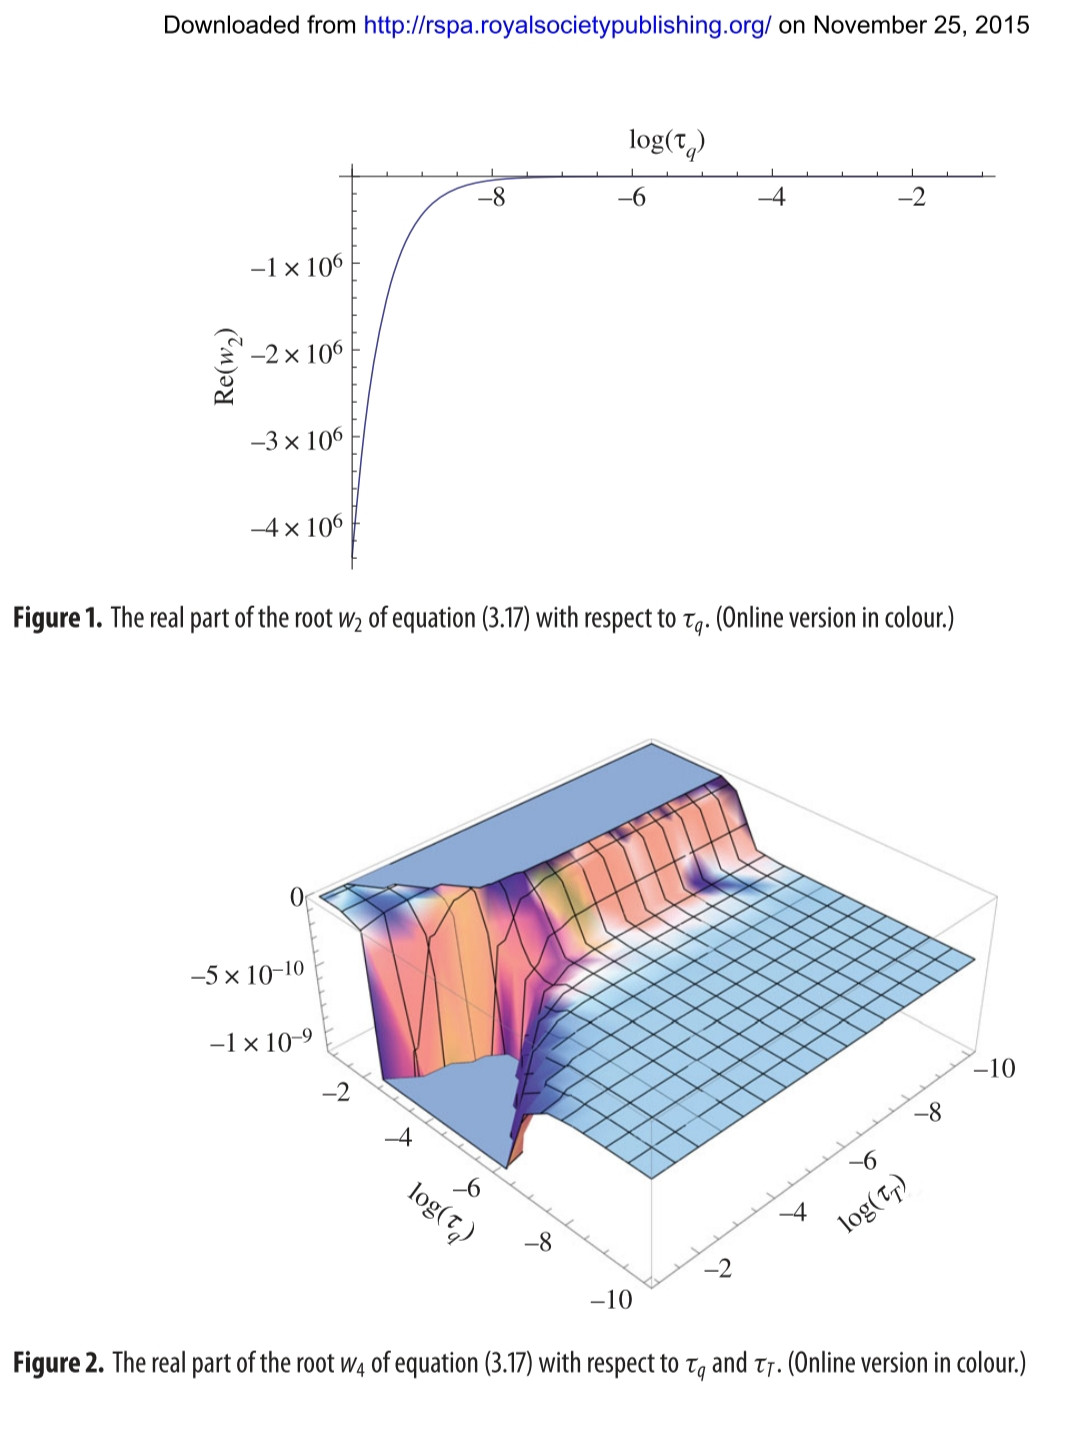
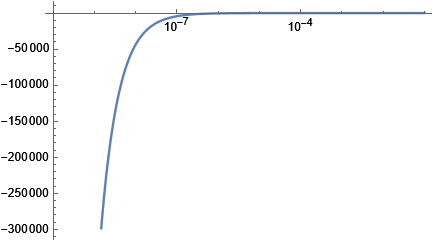
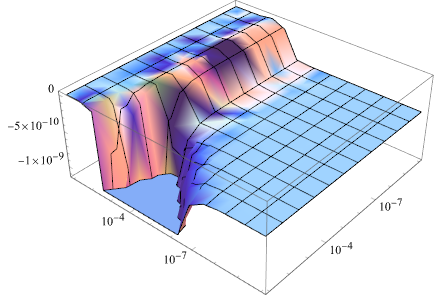
Some authors' have plotted the following graphs from the above equations. I don't know Mathematica very well but need some help for my research. enter image description here

Also, marked the extremum values and points if possible on both the graphs. Can anyone please help me for plotting like above two figures? I am in basic level in learning Mathematica 11.0. Seeking kind help!

Thank you very much.

$\endgroup$
0

3 Answers 3

1
$\begingroup$

Try this:

c1 = 4631.0; c2 = 2280.1; d = 8066.8; e = 0.0168; k = 1;
eqn = (1 + (c2^2/c1^2)*w^2)*(1 + 
      k*taoT*c2*w + (c2*d/k)*
       w*(1 + k*tauq*c2*w + (1/2)*k^2*tauq^2*c2^2*w^2)) + (e*c2*d/k)*
    w*(1 + k*tauq*c2*w + (1/2)*k^2*tauq^2*c2^2*w^2) == 0

(*  309004. w (1 + 2280.1 tauq w + 2.59943*10^6 tauq^2 w^2) + (1 + 
     0.242414 w^2) (1 + 2280.1 taoT w + 
     1.83931*10^7 w (1 + 2280.1 tauq w + 2.59943*10^6 tauq^2 w^2)) == 
 0  *)

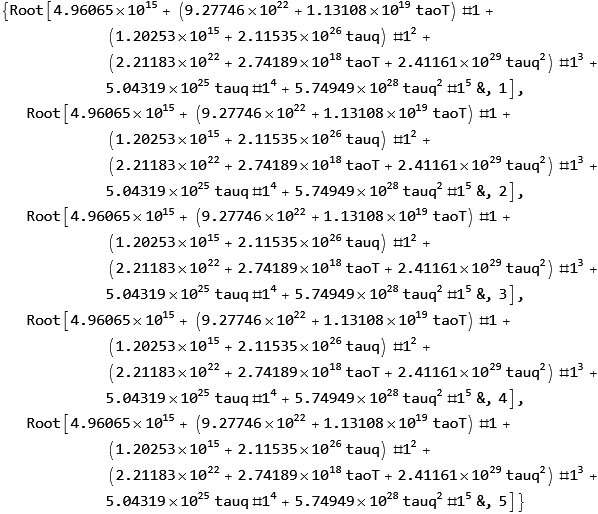
The solve it:

nsl = NSolve[eqn, w];

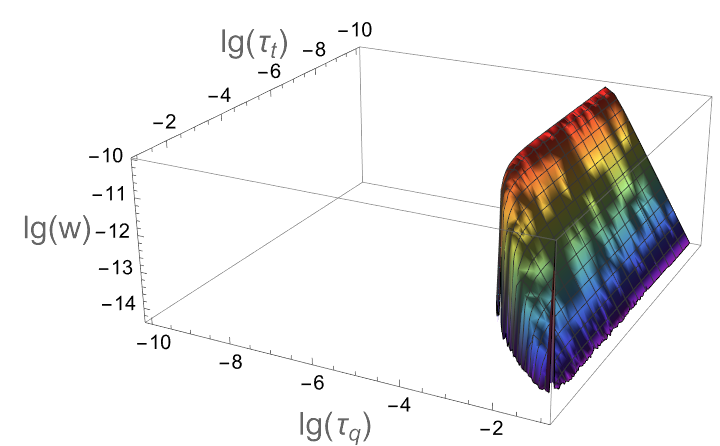
It returns 5 solutions. The 4th and 5th one can plot. The plots are equal in this case:

Plot3D[Log[10, 
  Re[w] /. nsl[[4, 1]] /. {taoT -> 10^t, 
    tauq -> 10^q}], {t, -10, -1}, {q, -10, -1}, 
 AxesLabel -> {Style["lg(\!\(\*SubscriptBox[\(τ\), \(t\)]\))", 
    16], Style["lg(\!\(\*SubscriptBox[\(τ\), \(q\)]\))", 16], 
   Style["lg(w)", 16]}, PlotPoints -> 20, ColorFunction -> "Rainbow"]

returning the following plot:

enter image description here

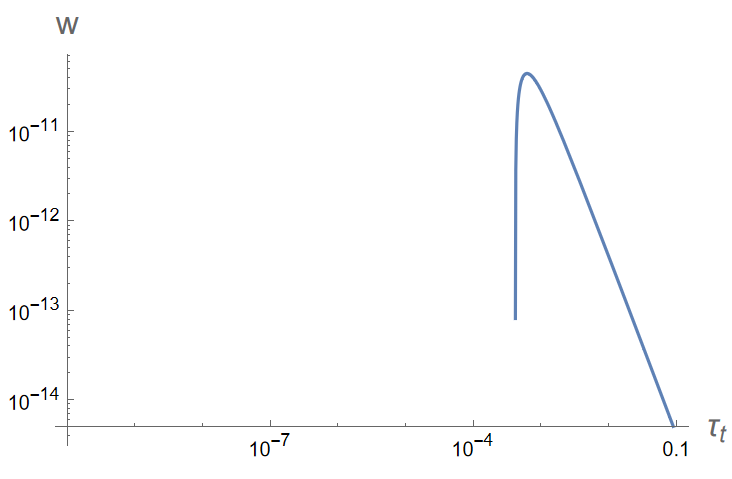
Further, the plot of the cross-section at taoT=10^-4:

LogLogPlot[
 Re[w] /. nsl[[4, 1]] /. taoT -> 10^-4, {tauq, 10^-10, 10^-1}, 
 PlotPoints -> 20, 
 AxesLabel -> {Style["\!\(\*SubscriptBox[\(τ\), \(t\)]\)", 16], 
   Style["w", 16]}]

yielding this:

enter image description here

Have fun!

$\endgroup$
1
$\begingroup$

First plot

ClearAll["Global`*"]
c1 = 4631.0; c2 = 2280.1; d = 8066.8; e = 0.0168; k = 1;
eqn = (1 + (c2^2/c1^2)*w^2)*(1 + 
      k*taoT*c2*w + (c2*d/k)*
       w*(1 + k*tauq*c2*w + (1/2)*k^2*tauq^2*c2^2*w^2)) + (e*c2*d/k)*
    w*(1 + k*tauq*c2*w + (1/2)*k^2*tauq^2*c2^2*w^2) == 0;
sol=NSolveValues[eqn,w];

Mathematica graphics

  Plot[Re@sol[[2]]/.taoT->10^-1,{tauq,10^-10,10^-1},
     ScalingFunctions->{"Log",Identity},PerformanceGoal->"Quality"]

Mathematica graphics

Second plot

Plot3D[Re@sol[[4]],{tauq,10^-10,10^-1},{taoT,10^-10,10^-1},
 ScalingFunctions->{"Log","Log",Identity},
 Mesh->10,PlotTheme->"Classic"]

Mathematica graphics

$\endgroup$
6
  • $\begingroup$ Nasser Sir, I am grateful to you for such an wonderful code! Could you please tell me which version of Mathematica you are using because I'm using version 11.0 and when I run this code in my PC, it shows blank! $\endgroup$ Commented Oct 5, 2023 at 9:14
  • $\begingroup$ @NantuSarkar I am using V 13.3.1 on windows 10. Here is link to the notebook $\endgroup$
    – Nasser
    Commented Oct 5, 2023 at 9:20
  • $\begingroup$ Sir What should I do to run it using V 11.0 on Windows 7? $\endgroup$ Commented Oct 5, 2023 at 9:28
  • $\begingroup$ @NantuSarkar If the above code does not run the same on V 11, then I am afraid I can't help, as I use V 13.3.1. May be someone will have an idea where it does not work on V 11. $\endgroup$
    – Nasser
    Commented Oct 5, 2023 at 9:32
  • $\begingroup$ Nasser Sir, when I run the code from your notebook, I got empty figure! Could you please resolved the issue?It would be great help for me sir!I run other program (mathematica.stackexchange.com/questions/275780/…) of you and get nice figure sir. So, V 11.0 is not the problem I think. $\endgroup$ Commented Oct 5, 2023 at 13:14
0
$\begingroup$
$Version

(* "13.3.1 for Mac OS X ARM (64-bit) (July 24, 2023)" *)

Clear["Global`*"]

Format[tau[x_]] := Subscript[τ, x]

eqn = (1 + (c2^2/c1^2)*w^2)*(1 + 
       k*tau[T]*c2*w + (c2*d/k)*
        w*(1 + k*tau[q]*c2*w + (1/2)*k^2*tau[q]^2*c2^2*w^2)) + (e*c2*
       d/k)*w*(1 + k*tau[q]*c2*w + (1/2)*k^2*tau[q]^2*c2^2*w^2) == 0;

c1 = 4631; c2 = 22801/10; d = 80668/10; e = 168*^-4; k = 1;

roots = Solve[eqn, w];

n = Length@roots;

Plotting,

Manipulate[
 Module[{min, max, ptMin, ptMax},
  {min, max} = #[{func[w /. roots[[r]]] /.
        {tau[T] -> 10^logtT, tau[q] -> 10^x},
       -10 < x < -1}, x, WorkingPrecision -> 20] & /@
    {NArgMin, NArgMax};
  ptMin = {min, func[w /. roots[[r]]] /.
     {tau[T] -> 10^logtT, tau[q] -> 10^min}};
  ptMax = {max, func[w /. roots[[r]]] /.
     {tau[T] -> 10^logtT, tau[q] -> 10^max}};
  Show[Plot[
    func[w /. roots[[r]]] /. {tau[T] -> 10^logtT, 
      tau[q] -> 10^logtq},
    {logtq, -10, -1},
    PlotRange -> All,
    AxesOrigin -> {-10, 0},
    Frame -> {{True, False}, {False, True}},
    FrameTicks -> {{All, False}, {False, All}},
    FrameLabel -> {
      {StringForm["``(``)", func, Subscript[w, r]], None},
      {None, Log[tau[q]]}},
    WorkingPrecision -> 20,
    PlotPoints -> 50,
    MaxRecursion -> 5,
    ImageSize -> Medium],
   ListPlot[{{Callout[ptMin, NumberForm[ptMin, {5, 2}],
       Background -> Opacity[0]]},
     {Callout[ptMax, NumberForm[ptMax, {5, 2}],
       Below,
       Background -> Opacity[0]]}},
    PlotStyle -> Red,
    PlotMarkers -> {Style[▼, 14], 
      Style[▲, 14]}],
   PlotRangeClipping -> False,
   ImageSize -> Medium]],
 Row[{
   Control[{{func, Re, "function"}, {Re, Im, Abs},
     ControlType -> RadioButtonBar}],
   Spacer[50],
   Control[{{r, 2, "root"}, Range[n],
     ControlType -> RadioButtonBar}]}],
 Delimiter,
 {{logtT, -1, TraditionalForm[Log[tau[T]]]}, -10, -1, 0.05, 
  Appearance -> "Labeled"},
 SynchronousUpdating -> False,
 TrackedSymbols :> {func, r, logtT}]
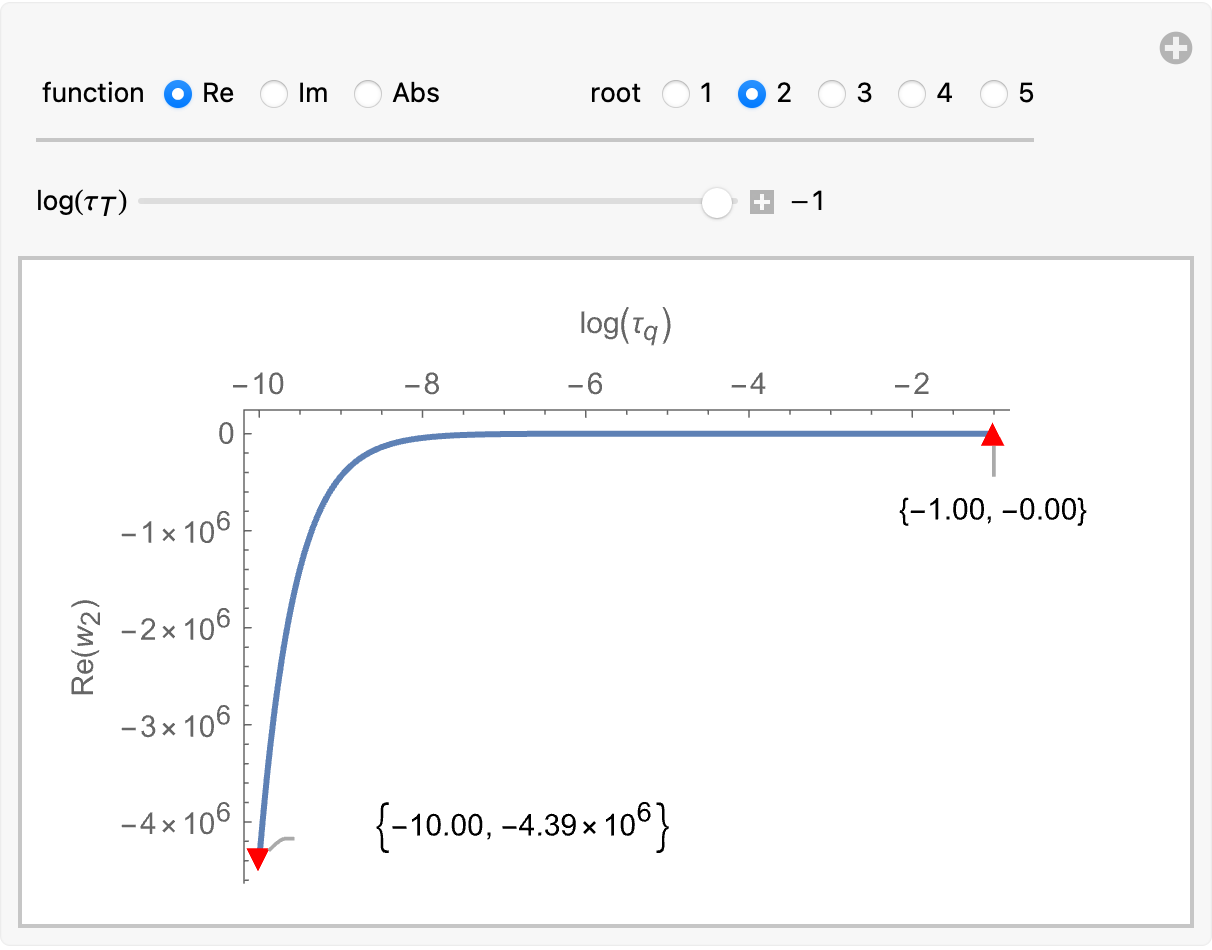
enter image description here

In the second plot, the PlotRange is restricted. The plot that you showed is clipped even more -- both top and bottom.

Manipulate[
 Module[{argMin, argMax, ptMin, ptMax},
  {argMin, argMax} = #[{func[w /. roots[[r]]] /.
         {tau[q] -> 10^x, tau[T] -> 10^y},
        -10 <= x <= -1, -10 <= y <= -1}, {x, y},
       WorkingPrecision -> 20][[-1]] & /@
    {NMinimize, NMaximize};
  {ptMin, ptMax} = ({-x, -y, func[w /. roots[[r]]] /.
         {tau[q] -> 10^x, tau[T] -> 10^y}} /. #) & /@
    {argMin, argMax};
  Show[
   Plot3D @@
    {func[w /. roots[[r]] /.
       {tau[T] -> 10^logtT, tau[q] -> 10^logtq}],
     {logtq, -10, -1}, {logtT, -10, -1},
     AxesLabel -> (Style[#, 14, Blue] & /@
        {Log[tau[q]], Log[tau[T]], ""}),
     If[pltRng,
      PlotRange -> All,
      PlotRange -> Automatic],
     ScalingFunctions -> {"Reverse", "Reverse"},
     WorkingPrecision -> 20,
     PlotPoints -> 50,
     MaxRecursion -> 5,
     ImageSize -> Medium,
     SphericalRegion -> True},
   Legended[
    Graphics3D[{Red,
      Text[Style[▲, 14], ptMax],
      Text[Style[▼, 14], ptMin]}],
    PointLegend[{Red, Red}, {
      StringForm["Max\n``", NumberForm[ptMax, {5, 2}]],
      StringForm["Min\n``", NumberForm[ptMin, {5, 2}]]},
     LegendMarkers -> {Style[▲, 14], 
       Style[▼, 14]}]]]],
 Row[
  {Control[
    {{func, Re, "function"}, {Re, Im, Abs},
     ControlType -> RadioButtonBar}],
   Spacer[20],
   Control[
    {{r, 4, "root"}, Range[n],
     ControlType -> RadioButtonBar}],
   Spacer[20],
   Control[{{pltRng, False, "Plot\nRange"}, {True -> "All", 
      False -> "Clipped"},
     ControlType -> RadioButtonBar}]}],
 SynchronousUpdating -> False,
 TrackedSymbols :> {func, r, pltRng}]
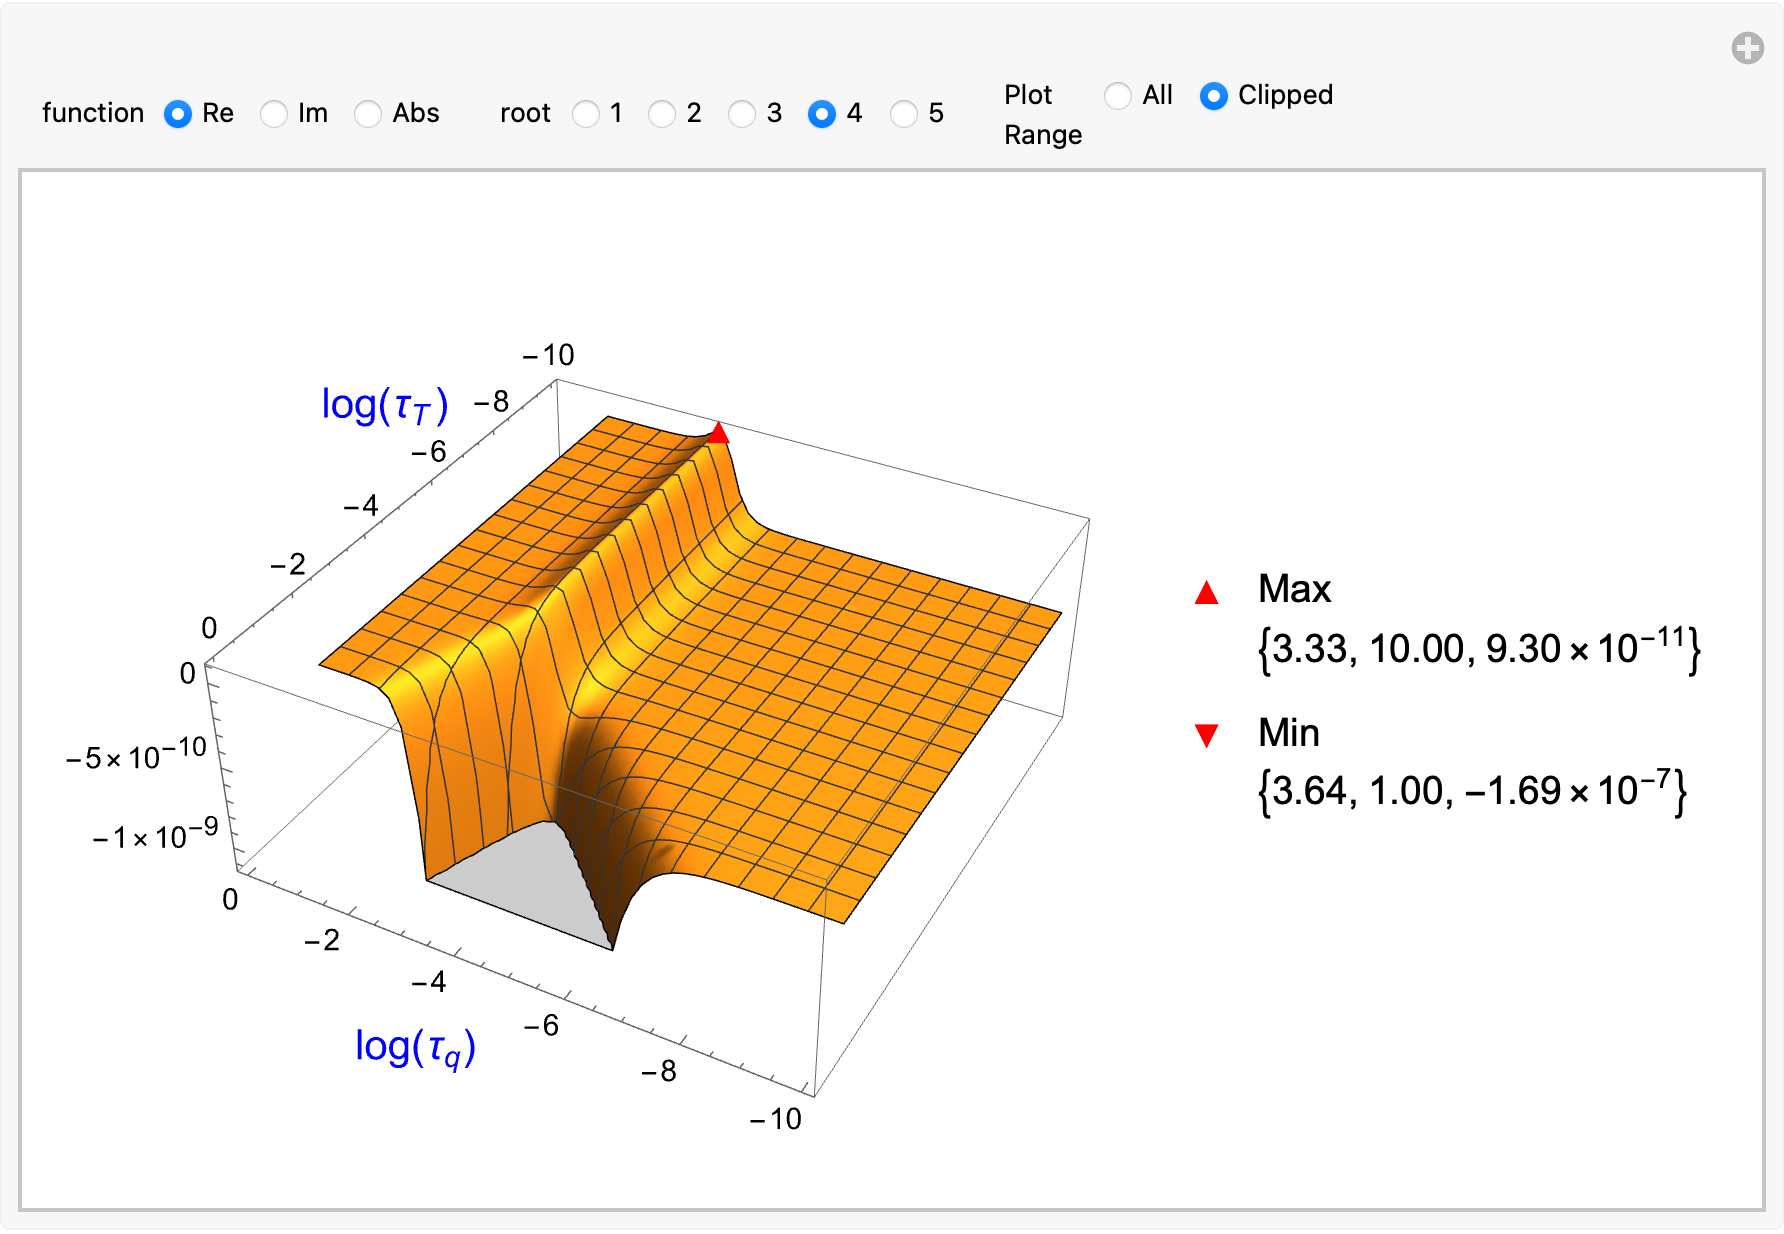
enter image description here

$\endgroup$
1
  • $\begingroup$ Thank you very much sir for nice code. Unfortunately I have V11 that is why I couldn't be able to run the code on my PC! Anyway I will be grateful to you for your kind help! $\endgroup$ Commented Oct 7, 2023 at 15:13

Your Answer

By clicking “Post Your Answer”, you agree to our terms of service and acknowledge you have read our privacy policy.

Not the answer you're looking for? Browse other questions tagged or ask your own question.