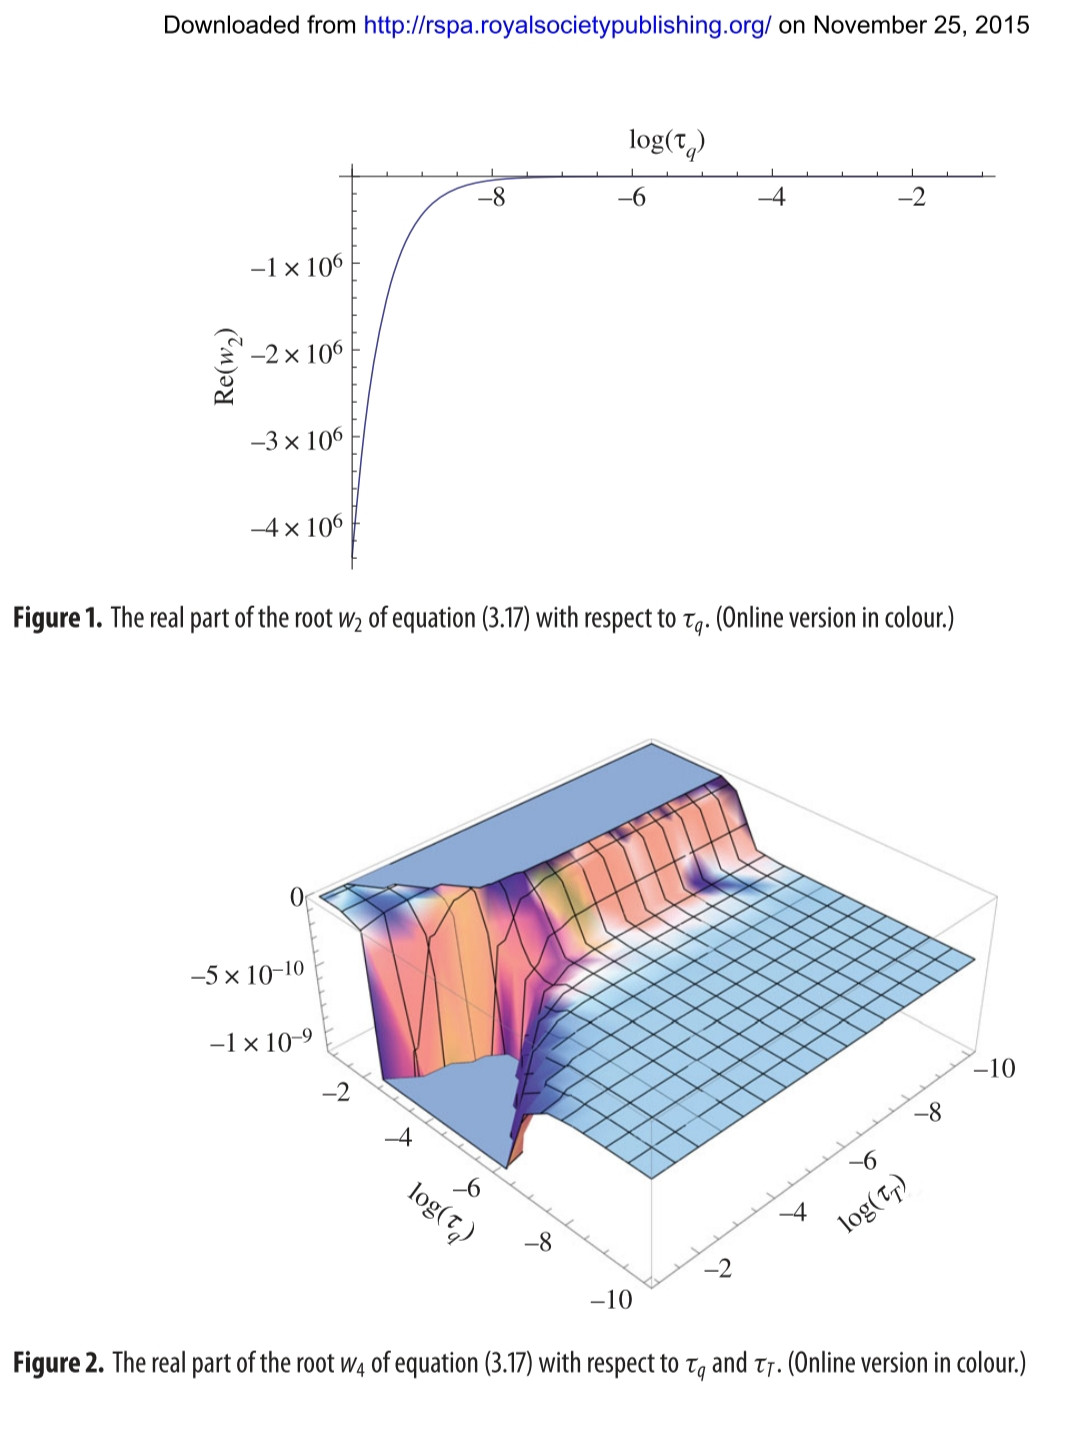
I have the following 5th degree Polynomial Equation in complex wave velocity w(tauT, tauq) as a function of real parameters taoT and tauq:
[1+eqn = (1 + (c2^2/c1^2)*w^2)*(1 w^2][1+k+ taoTk*taoT*c2*w c2+ w+(c2 dc2*d/ k) w *w*(1+1 k+ taoqk*tauq*c2*w c2+ w+(1/2) k^2 taoq^2 c2^2 w^2*k^2*tauq^2*c2^2*w^2)]+(e) c2+ d(e*c2*d/ k) w*w*(1 [1+k+ taoqk*tauq*c2*w c2+ w+(1/2) k^2 taoq^2 c2^2 w^2]*k^2*tauq^2*c2^2*w^2) === 0;
The parameters are given as:
c1=4631.0; c2=2280.1; d=8066.8; e=0.0168; k=1;
I want the following two plots:

The range for both of taoT and Taoq is:
[10^-10, 10^-1]
Some authors' have plotted the following graphs from the above equations. I don't know Mathematica very well but need some help for my research.

Also, marked the extremum values and points if possible on both the graphs. Can anyone please help me for my research.plotting like above two figures? I am in basic level in learning Mathematica 11.0. PleaseSeeking kind help me Sir/Madam.!
Thank you very much.
